Show/highlight the selected regions of interest on different image channels
Usage
roi_show(img, ind = c(1, 2))Arguments
- img
A
cimgobject or alistof multiple images such as the one returned fromroi_select- ind
A
numericobject of length two. For the channel indexes. or alistof similar vectors for each ofimgitems.
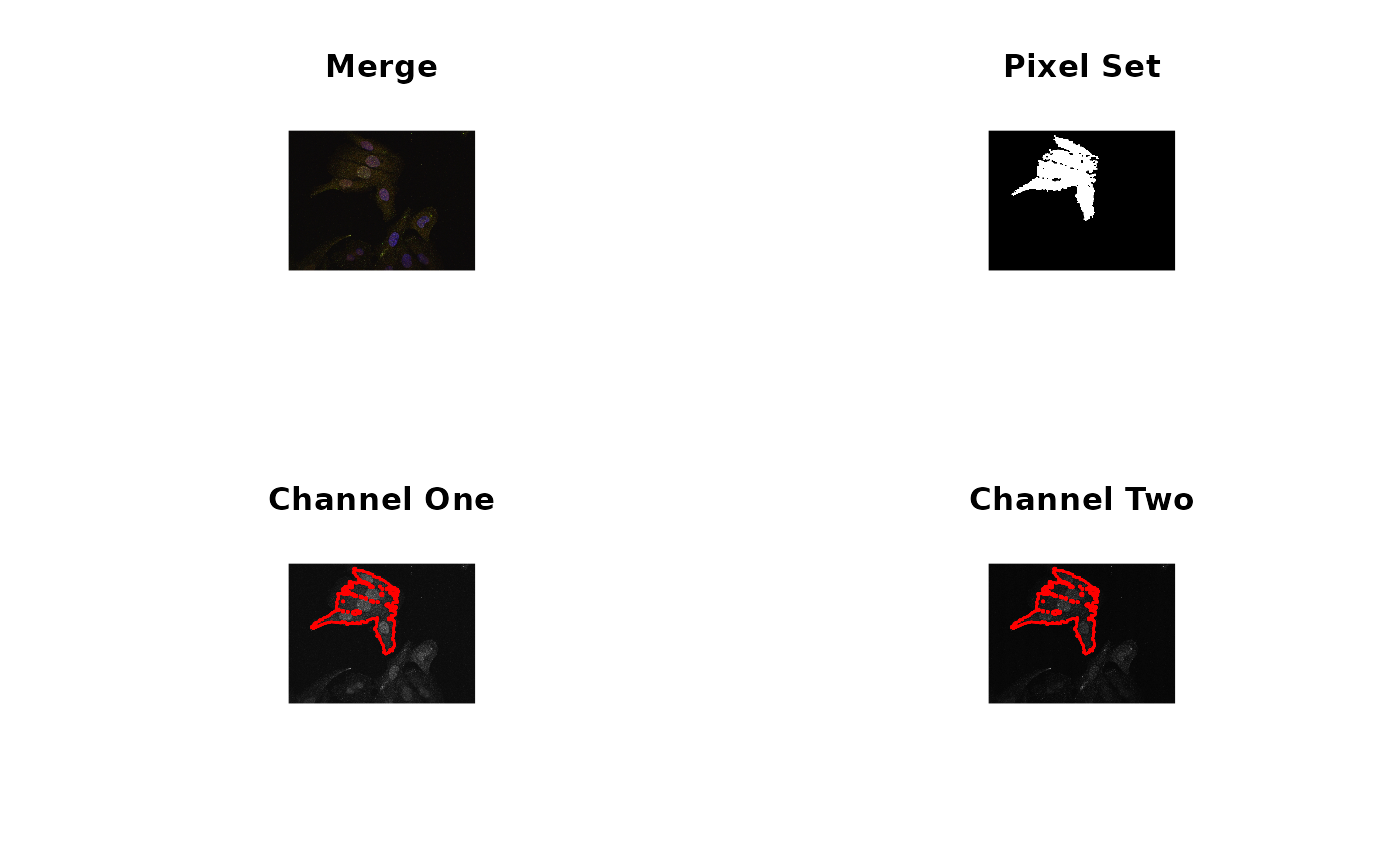
Details
calling this function with img object which is returned from
roi_select returns four different plots. The original image, a
low resolution representation of the selected regions of interest and the
two channels indicated through ind highlighted.
Examples
# load images
fl <- system.file('extdata', 'Image0001_.jpg', package = 'colocr')
img <- image_load(fl)

# choose and show ROI
oldpar <- par()
par(mfrow=c(2,2))

roi_select(img, threshold = 90) %>%
  roi_show()


par(oldpar)
#> Warning: graphical parameter "cin" cannot be set
#> Warning: graphical parameter "cra" cannot be set
#> Warning: graphical parameter "csi" cannot be set
#> Warning: graphical parameter "cxy" cannot be set
#> Warning: graphical parameter "din" cannot be set
#> Warning: graphical parameter "page" cannot be set