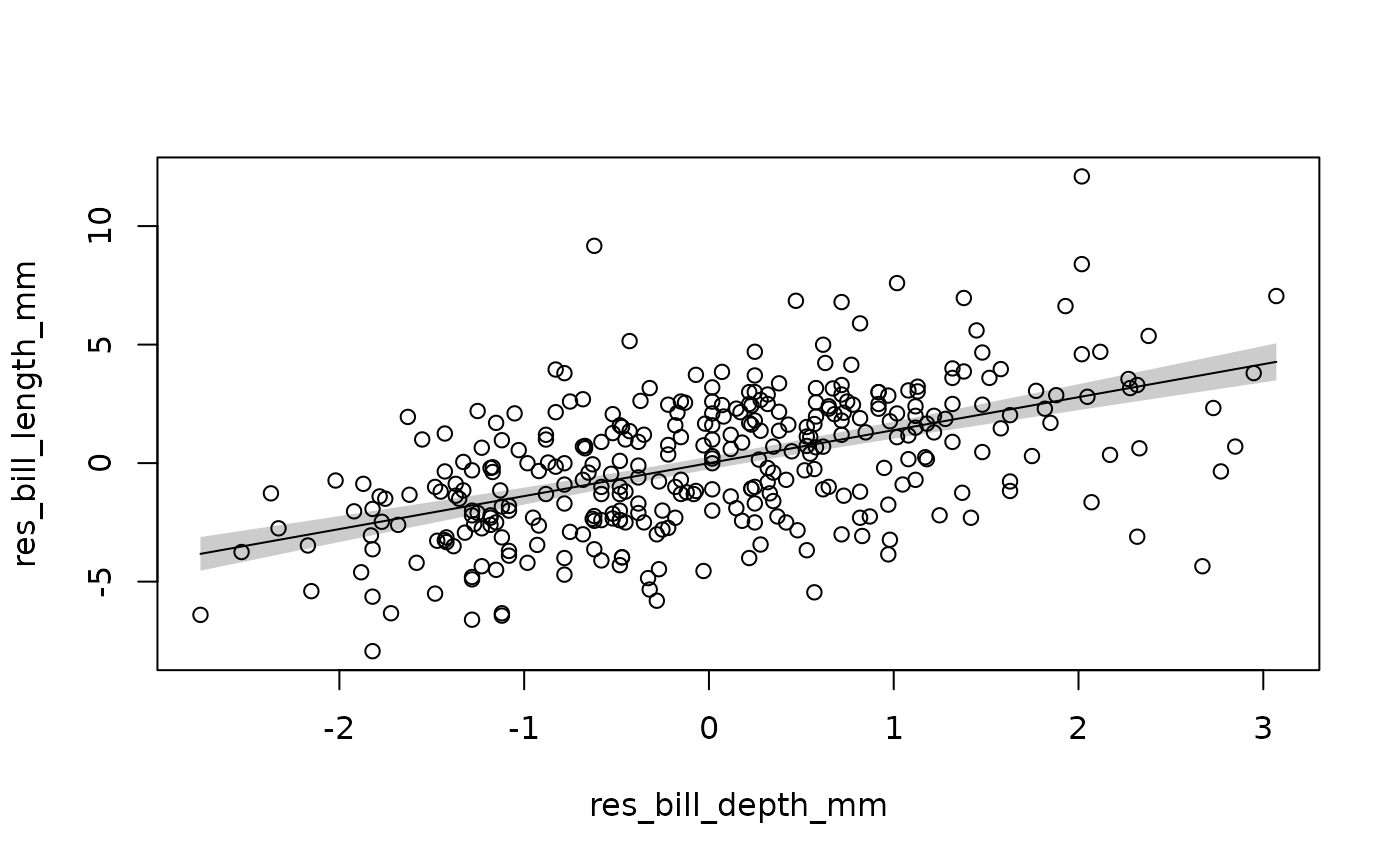
plot_partial_residuals: scatterplot of partial residuals
Source:R/plot_partial_residuals.R
plot_partial_residuals.RdFunction for plotting partial residuals
Uses tinyplot as backend
Arguments
- x
a partial_residuals objects from
partialling_out()- add_lm
if TRUE, a
lmwill be plotted- quantile
if TRUE, will plot only the mean values of the quantiles of the mean explanatory variable specified by
probs- probs
numeric vector of length one that specifies the number of quantiles to be computed if
quantileis TRUE. by default, 0.02, which will give 50 quantiles.- ...
Any other
tinyplot::plt()params
Examples
library(palmerpenguins)
library(fixest)
model <- feols(bill_length_mm ~ bill_depth_mm | species + island,
               data = penguins)
#> NOTE: 2 observations removed because of NA values (LHS: 2, RHS: 2).
partial_df <- partialling_out(model, penguins, both = TRUE)
plot_partial_residuals(partial_df)