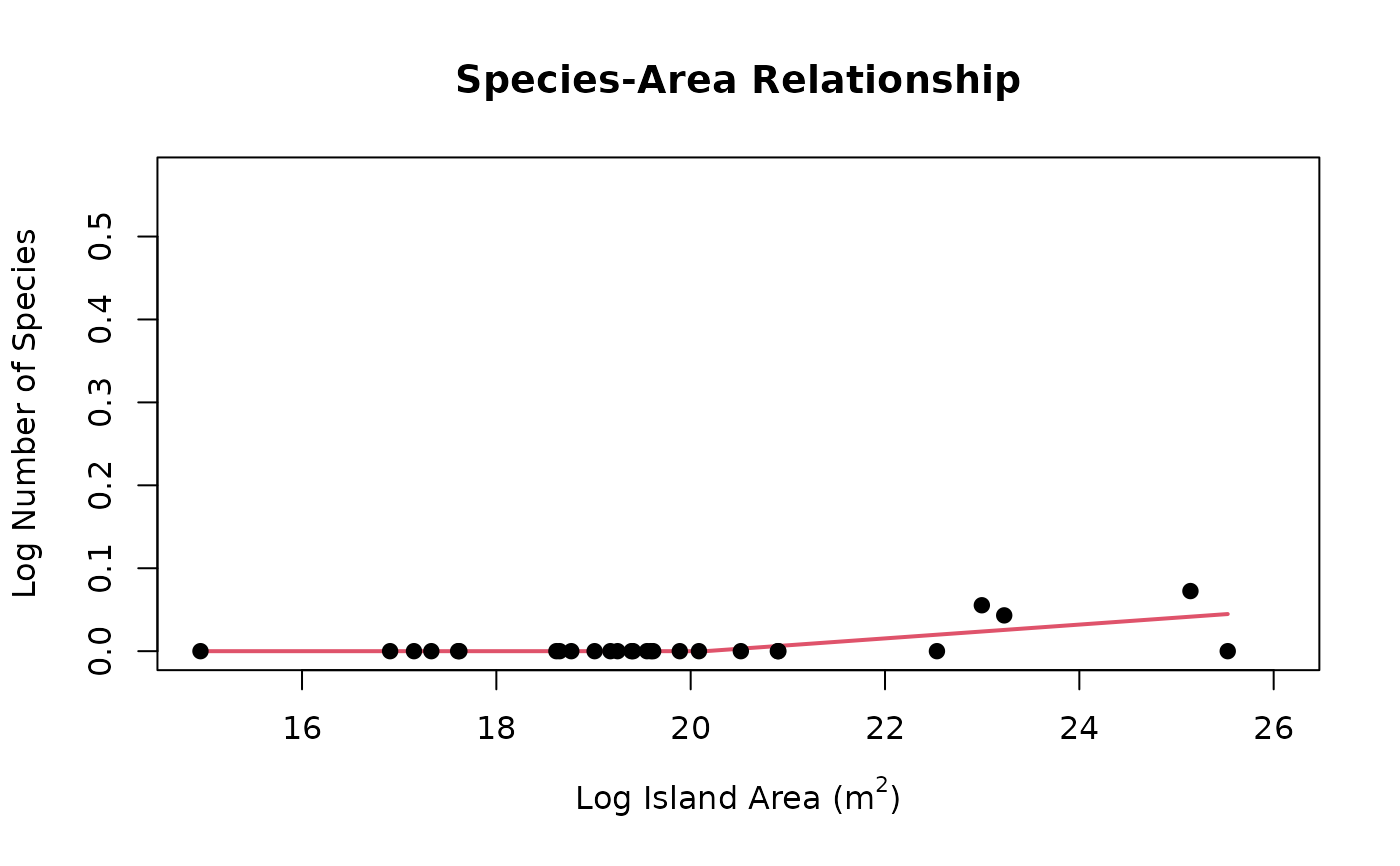
Use segmented regression to create a speciation-area relationship plot. The X axis represents log(island area) and the Y axis represents log(speciation rate)
Usage
create_spar(occurrences, npsi = 1, visualize = FALSE)

create_SpAR(occurrences, npsi = 1, visualize = FALSE)
Arguments
- occurrences
The dataframe output by one of ssarp's speciation methods (
ssarp::estimate_bamm(),ssarp::estimate_dr(),ssarp::estimate_ms()), or if using a custom dataframe, ensure that it has the following columns: areas, rate- npsi
The maximum number of breakpoints to estimate for model selection. If 0 is input, only a linear model will be run. Default: 1
- visualize
(boolean) Whether the plot should be displayed when the function is called. Default: FALSE
Value
A list of class SAR with 5 items including:
summary: the summary outputsegObjorlinObj: the regression object (segObjwhen segmented,linObjwhen linear)aggDF: the aggregated dataframe used to create the plotAICscores: the AIC scores generated during model selectionAllModels: a list of models created in model selection, labeled by number of breakpoints
Details
If the user would prefer to create their own plot of the
ssarp::create_spar() output, the aggDF element of the returned list
includes the raw points from the plot created here. They can be accessed
as demonstrated in the Examples section.
More information about the three methods for estimating speciation rate
included in ssarp can be found in ssarp's SpAR vignette.
Examples
# The GBIF key for the Anolis genus is 8782549
# Read in example dataset filtered from:
#  dat <- rgbif::occ_search(taxonKey = 8782549,
#                           hasCoordinate = TRUE,
#                           limit = 10000)
dat <- read.csv(system.file("extdata",
                            "ssarp_Example_Dat.csv",
                            package = "ssarp"))
land <- find_land(occurrences = dat)
areas <- find_areas(occs = land)
#> ℹ Recording island names...
#> ℹ Assembling island dictionary...
#> ℹ Adding areas to final dataframe...

# Read tree from Patton et al. (2021), trimmed to Caribbean species
tree <- ape::read.tree(system.file("extdata",
                                   "Patton_Anolis_Trimmed.tree",
                                   package = "ssarp"))

occ_speciation <- estimate_ms(tree = tree,
                              label_type = "epithet",
                              occurrences = areas)

seg <- create_spar(occurrences = occ_speciation,
                   npsi = 1,
                   visualize = FALSE)
plot(seg)

summary <- seg$summary
model_object <- seg$segObj
points <- seg$aggDF
summary <- seg$summary
model_object <- seg$segObj
points <- seg$aggDF