Illustrate the resampling of AGB values used in allodb
Source:R/illustrate_allodb.R
illustrate_allodb.RdThis function illustrates the resampling of AGB values used in allodb. It creates objects of class "ggplot".
Usage
illustrate_allodb(
  genus,
  coords,
  species = NULL,
  new_eqtable = NULL,
  logxy = FALSE,
  neq = 10,
  eqinfo = "equation_taxa",
  wna = 0.1,
  w95 = 500,
  nres = 10000
)
Arguments
- genus
A character value, containing the genus (e.g. "Quercus") of the tree.
- coords
A numeric vector of length 2 with longitude and latitude.
- species
A character value, containing the species (e.g. "rubra") of the tree. Default is
NULL, when no species identification is available.- new_eqtable
Optional. An equation table created with the
new_equations()function. Default is the base allodb equation table.- logxy
Logical: should values be plotted on a log scale? Default is
FALSE.- neq
Number of top equations in the legend. Default is 10, meaning that the 10 equations with the highest weights are shown in the legend.
- eqinfo
Which column(s) of the equation table should be used in the legend? Default is "equation_taxa".
- wna
a numeric vector, this parameter is used in the
weight_allom()function to determine the dbh-related and sample-size related weights attributed to equations without a specified dbh range or sample size, respectively. Default is 0.1.- w95
a numeric vector, this parameter is used in the
weight_allom()function to determine the value at which the sample-size-related weight reaches 95% of its maximum value (max=1). Default is 500.- nres
number of resampled values. Default is "1e4".
Value
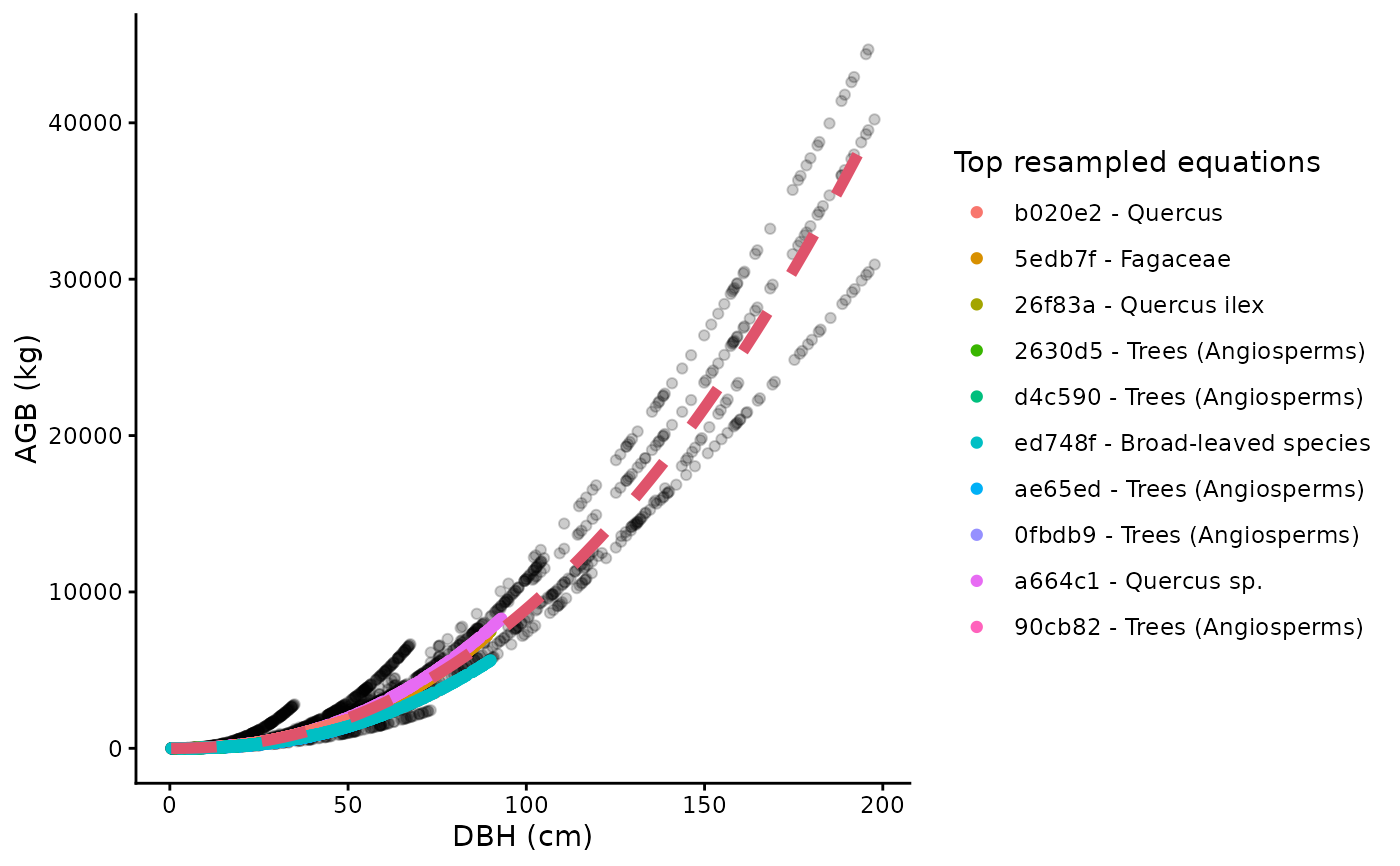
An object of class "ggplot" showing all resampled dbh-agb values. The top equations used are shown in the legend. The red curve on the graph represents the final fitted equation.
Examples
illustrate_allodb(
  genus = "Quercus",
  species = "rubra",
  coords = c(-78.2, 38.9)
)