fire_exp_extract_map() standardizes the visualization of
outputs from fire_exp_extract() as a map by classifying
exposure into predetermined exposure classes.
The plot is returned as a tmap object which can be further customized using
tmap commands or exported/saved to multiple image file formats. See
tmap::tmap_save() for export details.
Arguments
- values_ext
Spatvector of points or polygons from
fire_exp_extract()- classify
character, either
"local","landscape", or"custom", to specify classification scheme to use. The default is"local". If set to"custom": the parameterclass_breaksmust be used.- class_breaks
vector of numeric values between 0-1. Ignored unless
classify = "custom". See details.- method
character, either
"max"or"mean". Ifvalues_extare polygons the default is"max".This parameter is ignored whenvalues_extare point features.- title
(Optional) String. Ignored when
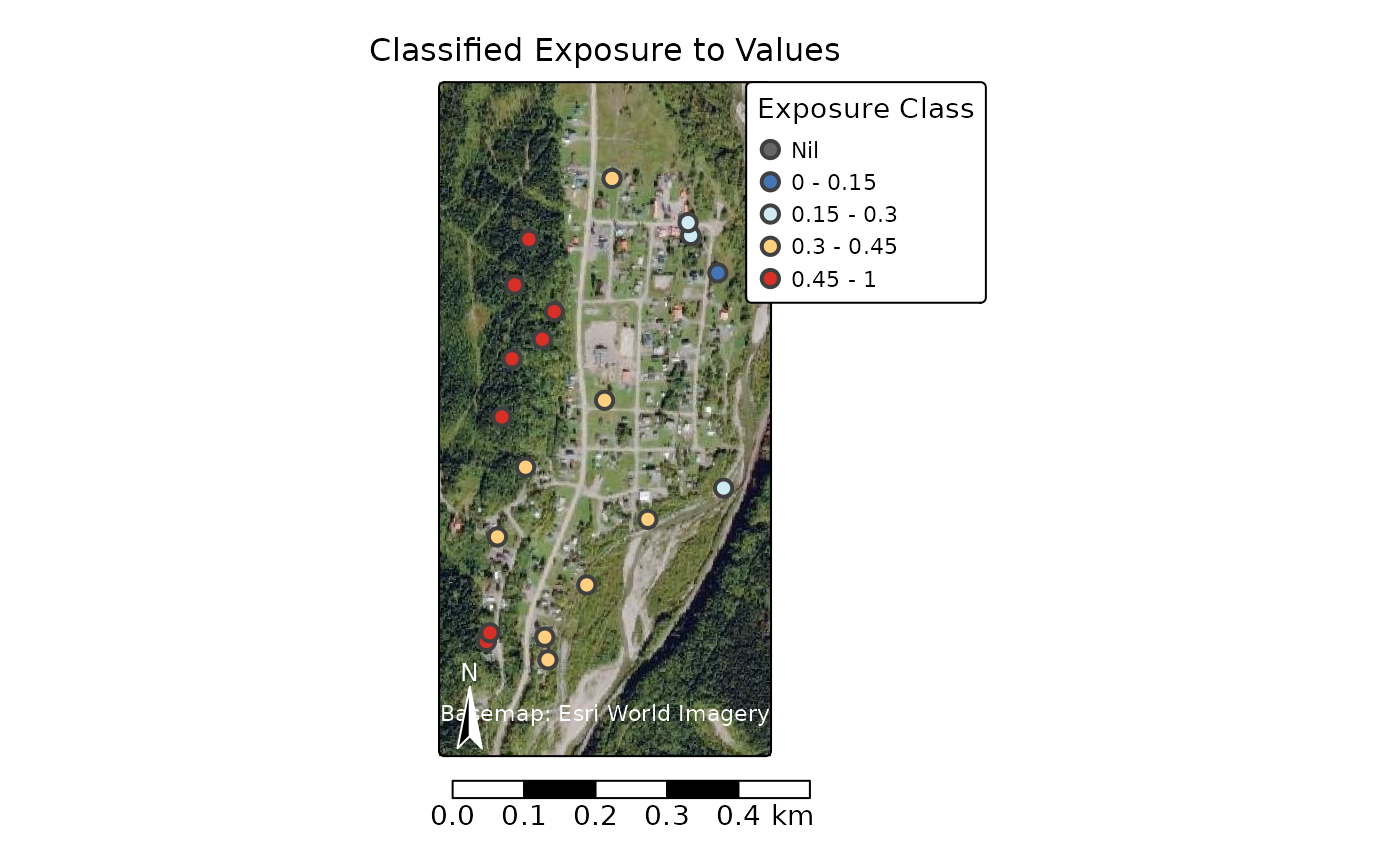
map = FALSE. A custom title for the plot. The default is"Classified Exposure to Values"
Details
This function visualizes the outputs from fire_exp_extract() with classes.
Classes can be chosen from the pre-set "local" and "landscape" options,
or customized. To use a custom classification scheme, it should be defined
with a list of numeric vectors defining the upper limits of the breaks. A
Nil class is added automatically for exposure values of exactly zero.
Local classification breaks are predefined as c(0.15, 0.3, 0.45, 1):
Nil (0)
0 - 0.15
0.15 - 0.3
0.3 - 0.45
0.45 - 1
#' Landscape classification breaks are predefined
as c(0.2, 0.4, 0.6, 0.8, 1):
Nil (0)
0 - 0.2
0.2 - 0.4
0.4 - 0.6
0.6 - 0.8
0.8 - 1
Spatial reference
This function dynamically pulls map tiles for a base map. The crs is set
automatically. See tmap::tm_crs() for details.
Examples
# read example hazard data
hazard_file_path <- "extdata/hazard.tif"
hazard <- terra::rast(system.file(hazard_file_path, package = "fireexposuR"))

# read example area of interest
polygon_path <- system.file("extdata", "polygon.shp", package ="fireexposuR")
aoi <- terra::vect(polygon_path)

# generate random points within the aoi polygon
points <- terra::spatSample(aoi, 20)

# compute exposure
exposure <- fire_exp(hazard)

values_exp <- fire_exp_extract(exposure, points)

# visualize example points in standardized map
fire_exp_extract_map(values_exp)
#> [plot mode] fit legend/component: Some legend items or map compoments do not
#> fit well, and are therefore rescaled.
#> ℹ Set the tmap option `component.autoscale = FALSE` to disable rescaling.