Map exposure with a continuous scale (Deprecated)
Source:R/fire_exp_map_cont.R
fire_exp_map_cont.RdThis function still works, but will be removed in future
versions of the package. The same functionality is now included in
fire_exp_map(). .
Arguments
- exposure
SpatRaster from
fire_exp()- aoi
(Optional) SpatVector of an area of interest to mask the exposure
- title
(Optional) String. A custom title for the plot. The default is
"Wildfire Exposure"
Details
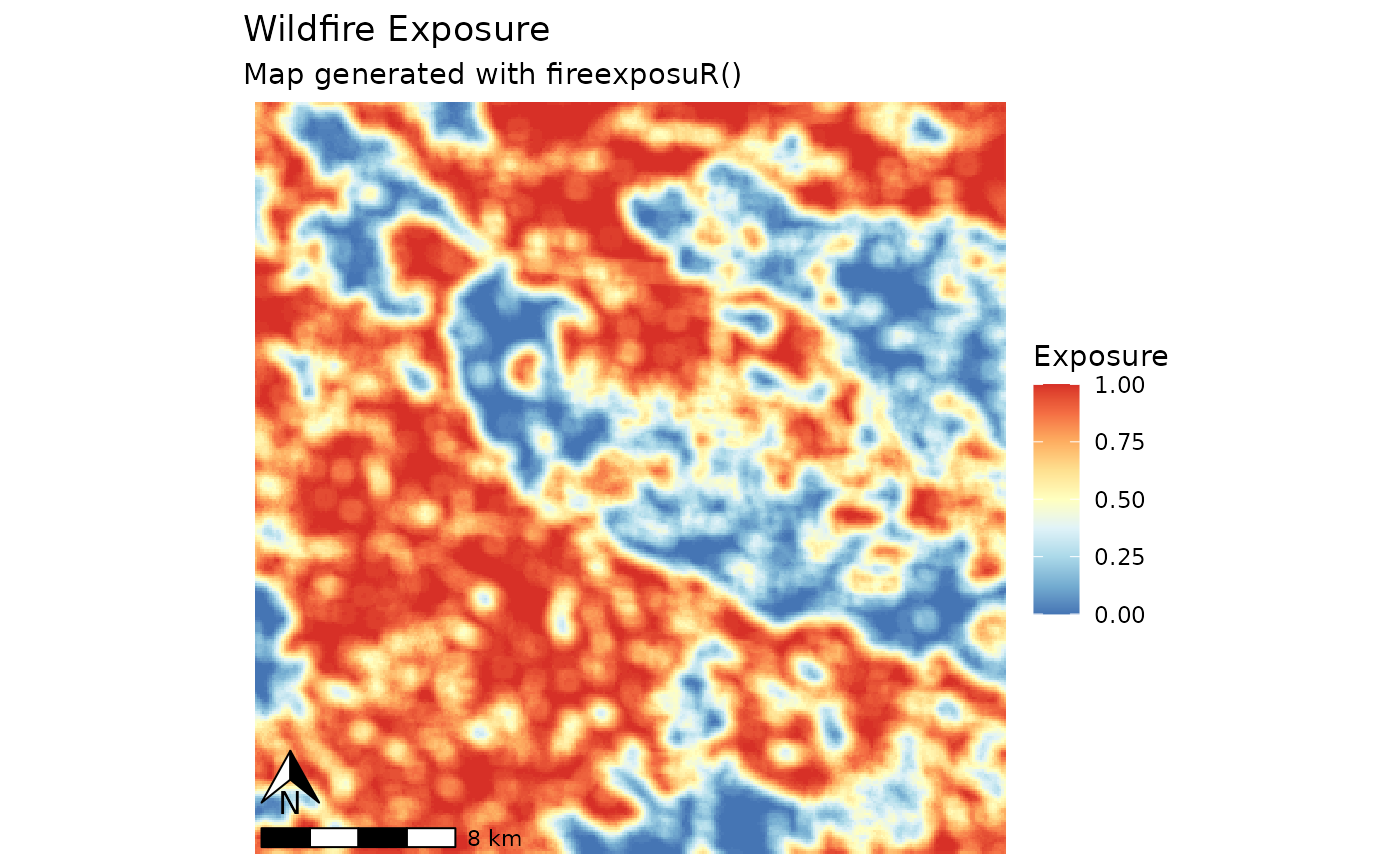
This function returns a standardized map with basic cartographic elements. The exposure values are mapped using a continuous scale. There is no base map added with this function.
The plot is returned as a ggplot object which can be exported/saved to multiple image file formats.
Examples
# read example hazard data
hazard_file_path <- "extdata/hazard.tif"
hazard <- terra::rast(system.file(hazard_file_path, package = "fireexposuR"))

# Compute exposure
exposure <- fire_exp(hazard)

fire_exp_map_cont(exposure)
#> Warning: 'fire_exp_map_cont' is deprecated.
#> Use 'fire_exp_map' instead.
#> See help("Deprecated")