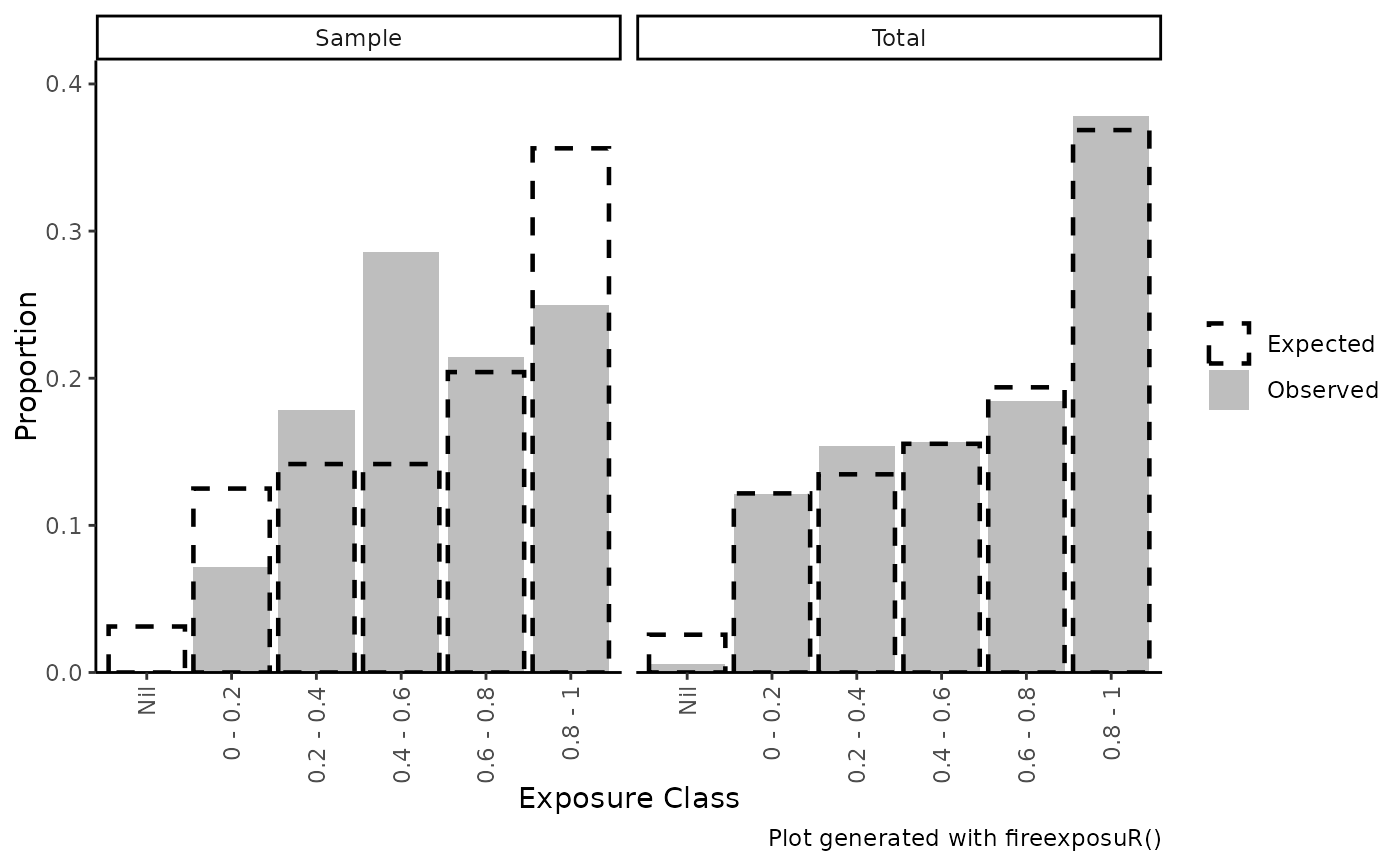
fire_exp_validate_plot() Visualizes the results from
fire_exp_validate() in a bar plot
Usage
fire_exp_validate_plot(
  validation_table,
  what = c("both", "total", "sample"),
  title
)
Arguments
- validation_table
The output table from
fire_exp_validate()- what
string. Which plot should be returned? Can be
"sample","total",or"both"(Default)- title
Optional. String. Add a custom title to the plot.
Examples
# read example hazard data
hazard_file_path <- "extdata/hazard.tif"
hazard <- terra::rast(system.file(hazard_file_path, package = "fireexposuR"))

polygon_path <- system.file("extdata", "polygon.shp", package ="fireexposuR")
polygon <- terra::vect(polygon_path)
no_burn <- terra::rasterize(polygon, hazard)

# generate example fire polygons by buffering random points
points <- terra::spatSample(terra::rescale(hazard, 0.8),
                            30, as.points = TRUE)
fires <- terra::buffer(points, 800)
# PLEASE NOTE THIS EXAMPLE DATA DOES NOT GENERATE MEANINGFUL RESULTS

# compute exposure and remove non-burnable cells
exposure <- fire_exp(hazard, no_burn = no_burn)

# results as table
validation_outputs <- fire_exp_validate(exposure, fires)

# results as bar chart
fire_exp_validate_plot(validation_outputs)