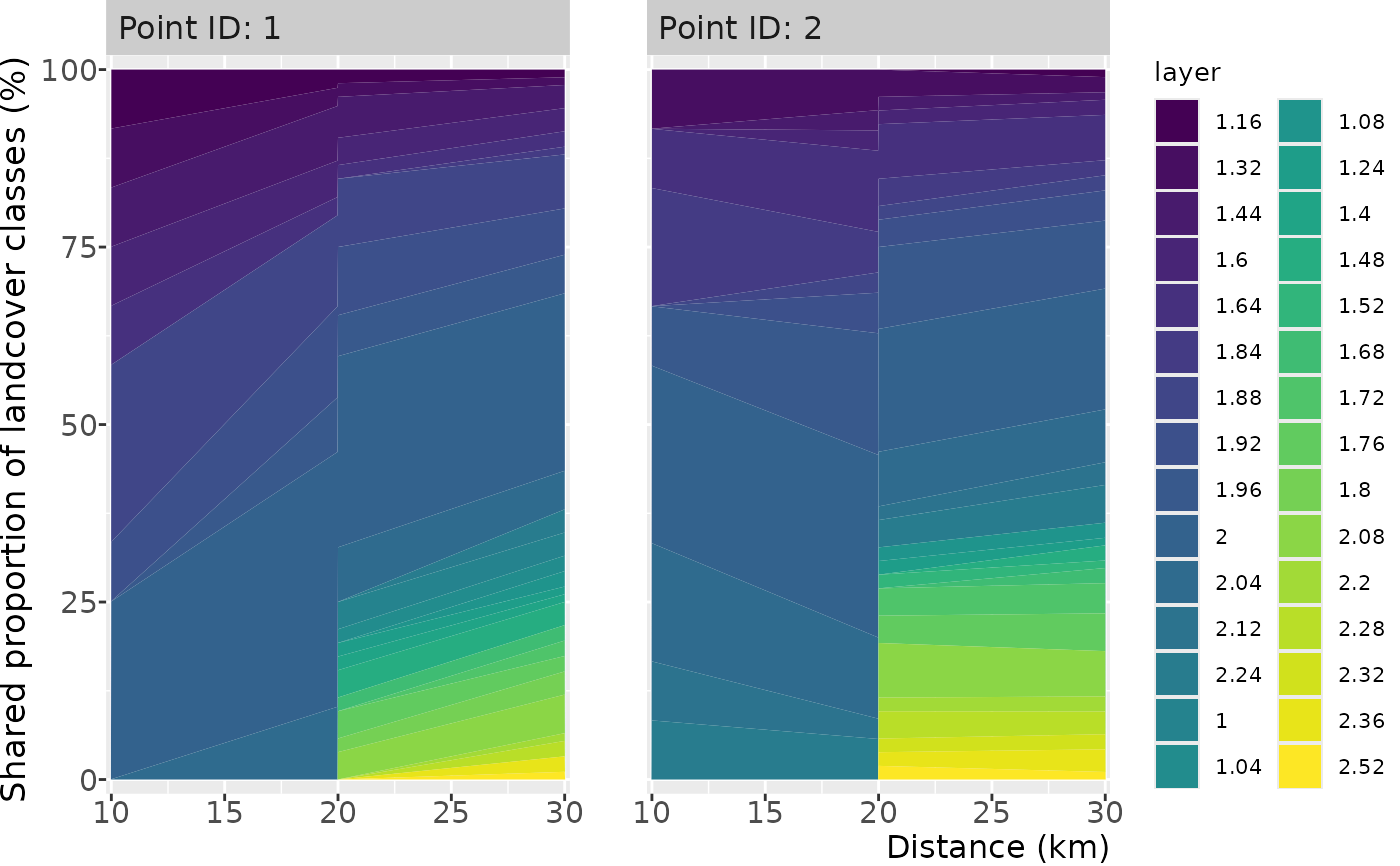
Plot the landscape share in subsequential buffers around a/multiple point(s) of interest
Usage
show_shareplot(
  landscape,
  points,
  buffer_width,
  max_width = NULL,
  multibuffer_df = NULL,
  return_df = FALSE
)

show_shareplot(
  landscape,
  points,
  buffer_width,
  max_width = NULL,
  multibuffer_df = NULL,
  return_df = FALSE
)
Arguments
- landscape
Raster* object
- points
Point(s) represented by a two-column matrix or data.frame; SpatialPoints*; SpatialPolygons*; SpatialLines; Extent; a numeric vector representing cell numbers; or sf* POINT object
- buffer_width
Buffer widths in which landscape share is measured. By default, it is a vector of buffer sizes, if
max_width = NULL. If a value if provided formax_width, a series of buffer sizes is created, frombuffer_widthtomax_width, with increases ofbuffer_width.- max_width
Max distance to which buffer_width is summed up; the x axis in the plot
- multibuffer_df
data.framewith landscape share or a function from it already extracted, such as through theutil_extract_multibuffer()function. If given, the other arguments (landscape,points,buffer_width,max_width) are ignored. Default is NULL.- return_df
Logical value indicating if a tibble with the underlying data should be returned
Examples
# Minimal runnable example with a pre-built multi-buffer data frame
df <- data.frame(
id = "Point ID: 1",
layer = factor(rep(1:3, each = 2)),
freq = c(10, 15, 20, 25, 5, 10),
buffer = rep(c(10, 20), 3)
)
show_shareplot(multibuffer_df = df)
 # \donttest{
# use a smaller aggregated landscape for the longer-running examples below
small_landscape <- raster::aggregate(classified_landscape, fact = 5)
# create single point
new_point <- matrix(c(75, 75), ncol = 2)
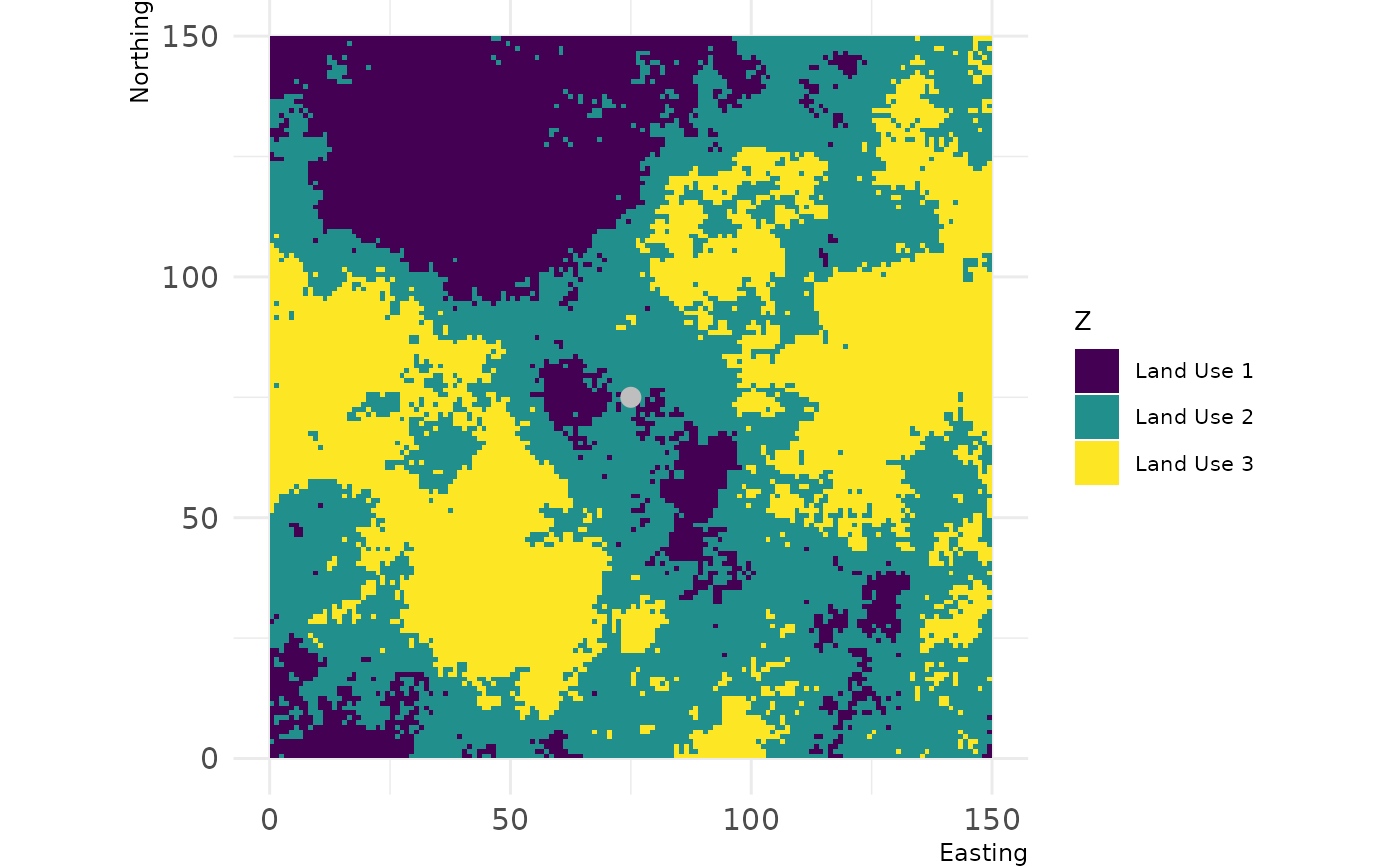
# show landscape and point of interest
show_landscape(small_landscape, discrete = TRUE) +
ggplot2::geom_point(data = data.frame(x = new_point[, 1], y = new_point[, 2]),
ggplot2::aes(x = x, y = y),
col = "grey", size = 3)
# \donttest{
# use a smaller aggregated landscape for the longer-running examples below
small_landscape <- raster::aggregate(classified_landscape, fact = 5)
# create single point
new_point <- matrix(c(75, 75), ncol = 2)
# show landscape and point of interest
show_landscape(small_landscape, discrete = TRUE) +
ggplot2::geom_point(data = data.frame(x = new_point[, 1], y = new_point[, 2]),
ggplot2::aes(x = x, y = y),
col = "grey", size = 3)
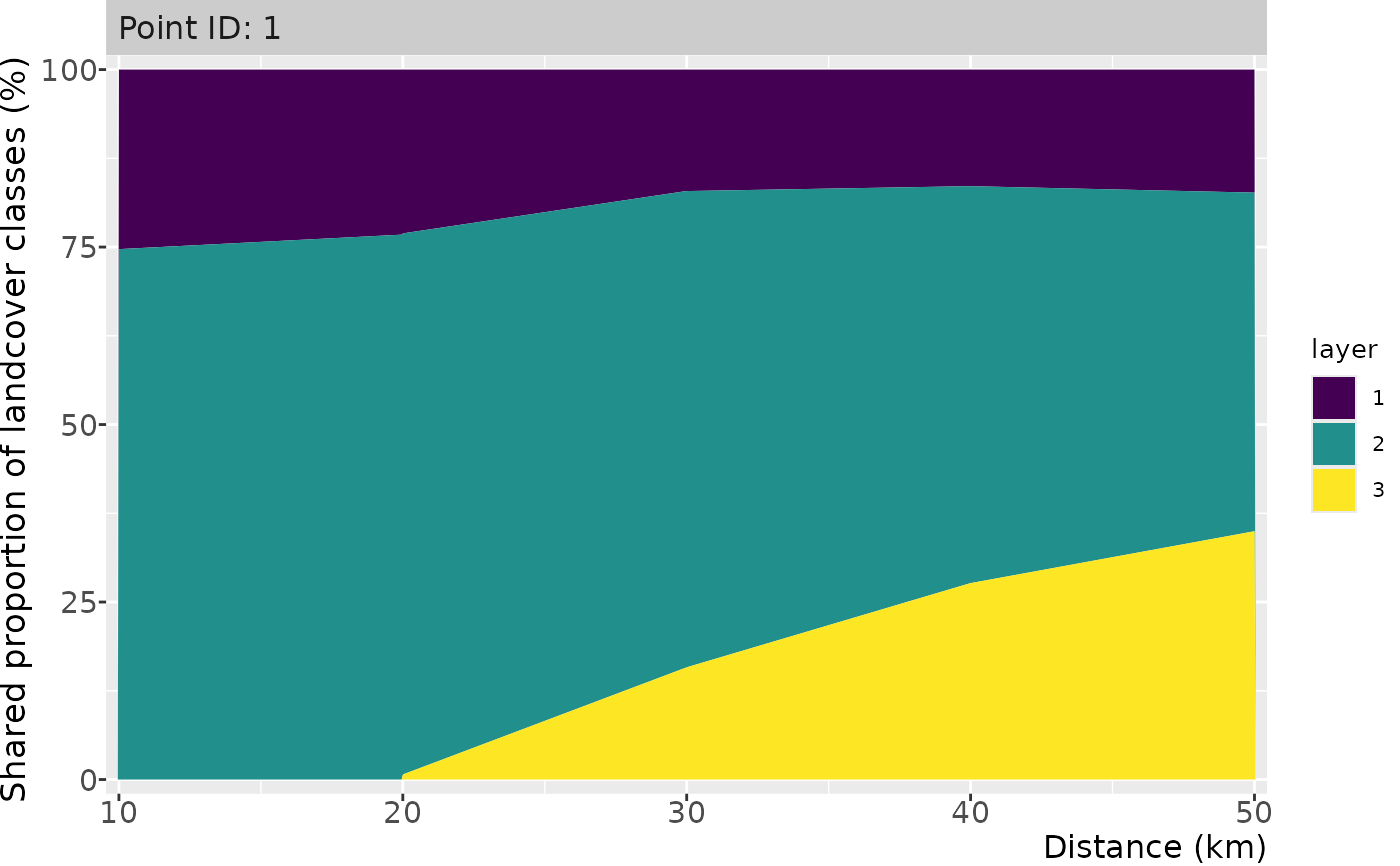 # show single point share
show_shareplot(small_landscape, new_point, 10, 30)
# show single point share
show_shareplot(small_landscape, new_point, 10, 30)
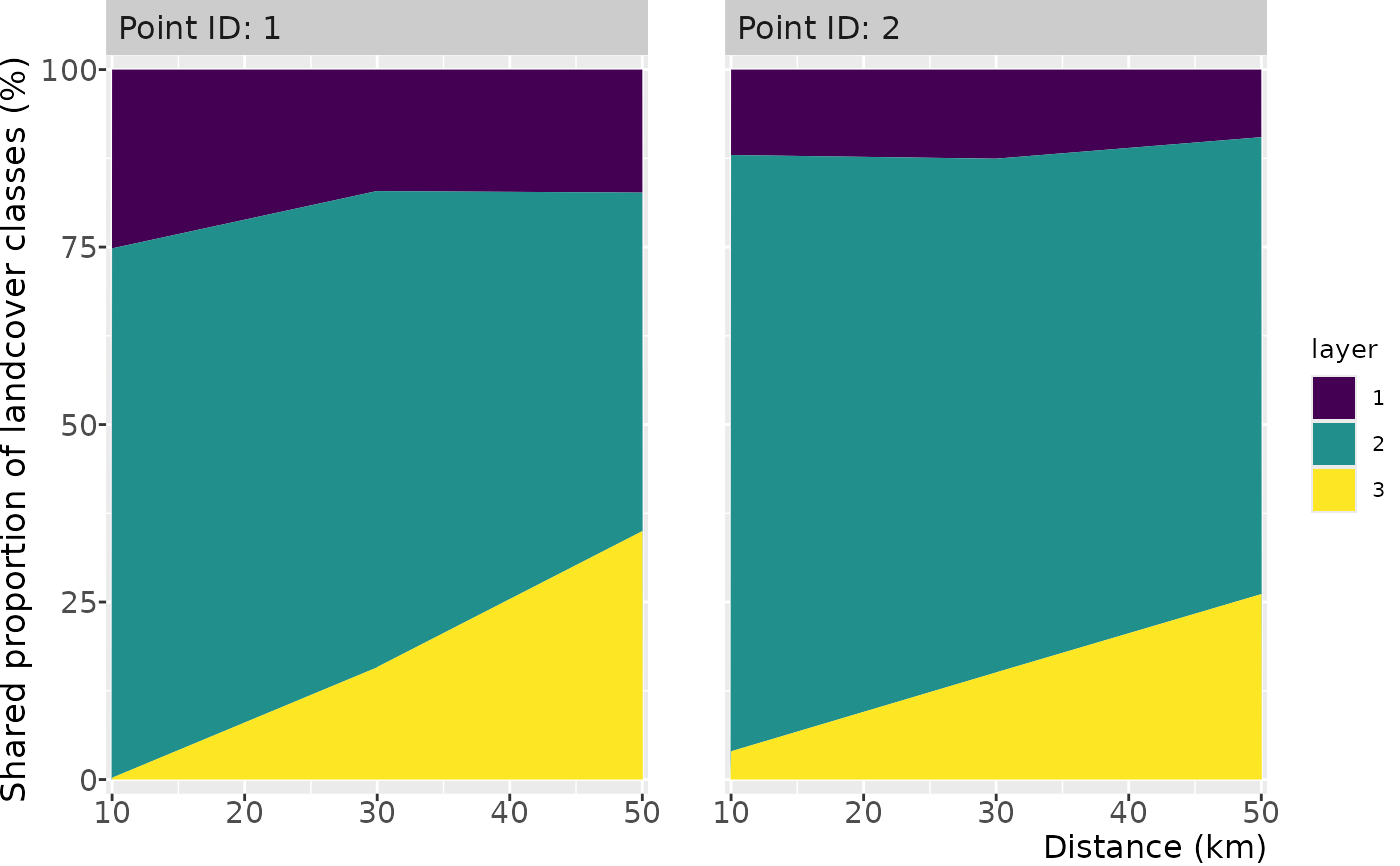
 # show multiple points share
new_points <- matrix(c(75, 110, 75, 30), ncol = 2)
show_shareplot(small_landscape, new_points, 10, 30)
# show multiple points share
new_points <- matrix(c(75, 110, 75, 30), ncol = 2)
show_shareplot(small_landscape, new_points, 10, 30)
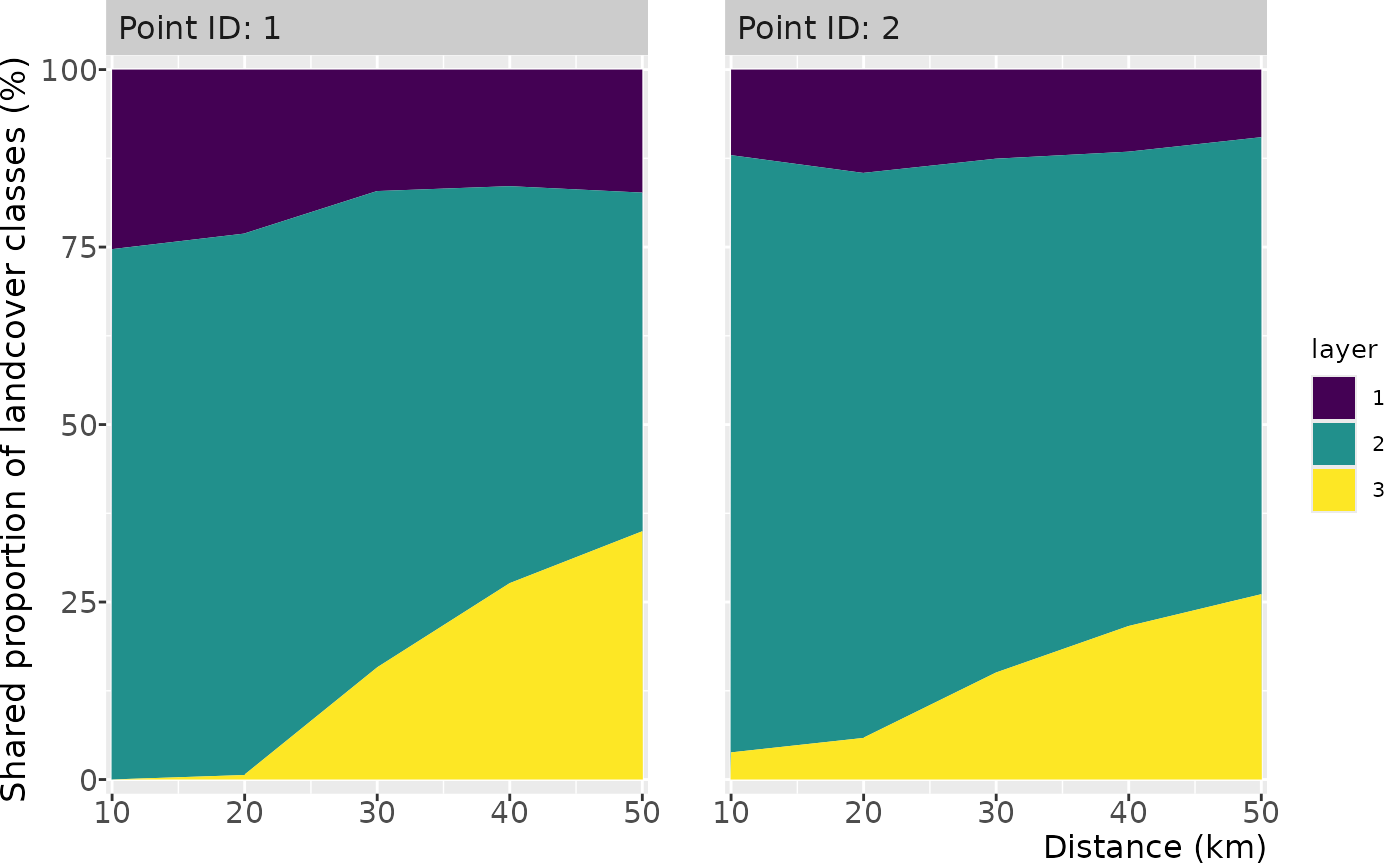
 # irregular buffer widths
show_shareplot(small_landscape, new_points, c(10, 30))
# irregular buffer widths
show_shareplot(small_landscape, new_points, c(10, 30))
 # get data frame with results back
result <- show_shareplot(small_landscape, new_points, 10, 30, return_df = TRUE)
result$share_df
#> # A tibble: 174 × 4
#> id layer freq buffer
#> <chr> <fct> <int> <dbl>
#> 1 Point ID: 1 1.16 1 10
#> 2 Point ID: 2 1.16 0 10
#> 3 Point ID: 1 1.32 1 10
#> 4 Point ID: 2 1.32 1 10
#> 5 Point ID: 1 1.44 1 10
#> 6 Point ID: 2 1.44 0 10
#> 7 Point ID: 1 1.6 1 10
#> 8 Point ID: 2 1.6 0 10
#> 9 Point ID: 1 1.64 1 10
#> 10 Point ID: 2 1.64 1 10
#> # ℹ 164 more rows
# use the output from util_extract_multibuffer
df <- util_extract_multibuffer(small_landscape, new_points, 10, 30)
show_shareplot(multibuffer_df = df)
# get data frame with results back
result <- show_shareplot(small_landscape, new_points, 10, 30, return_df = TRUE)
result$share_df
#> # A tibble: 174 × 4
#> id layer freq buffer
#> <chr> <fct> <int> <dbl>
#> 1 Point ID: 1 1.16 1 10
#> 2 Point ID: 2 1.16 0 10
#> 3 Point ID: 1 1.32 1 10
#> 4 Point ID: 2 1.32 1 10
#> 5 Point ID: 1 1.44 1 10
#> 6 Point ID: 2 1.44 0 10
#> 7 Point ID: 1 1.6 1 10
#> 8 Point ID: 2 1.6 0 10
#> 9 Point ID: 1 1.64 1 10
#> 10 Point ID: 2 1.64 1 10
#> # ℹ 164 more rows
# use the output from util_extract_multibuffer
df <- util_extract_multibuffer(small_landscape, new_points, 10, 30)
show_shareplot(multibuffer_df = df)
 # }
# }