Create a ggplot with axes set to pixel coordinates and plot the raster image on it using ggplot2::annotation_raster. See examples for how to plot an image onto an existing ggplot.
Arguments
- image
magick image object returned by
image_read()orimage_graph()- interpolate
passed to ggplot2::annotation_raster
Examples
# Plot with base R
plot(logo)
 # Plot image with ggplot2
library(ggplot2)
myplot <- image_ggplot(logo)
myplot + ggtitle("Test plot")
# Plot image with ggplot2
library(ggplot2)
myplot <- image_ggplot(logo)
myplot + ggtitle("Test plot")
 # Show that coordinates are reversed:
myplot + theme_classic()
# Show that coordinates are reversed:
myplot + theme_classic()
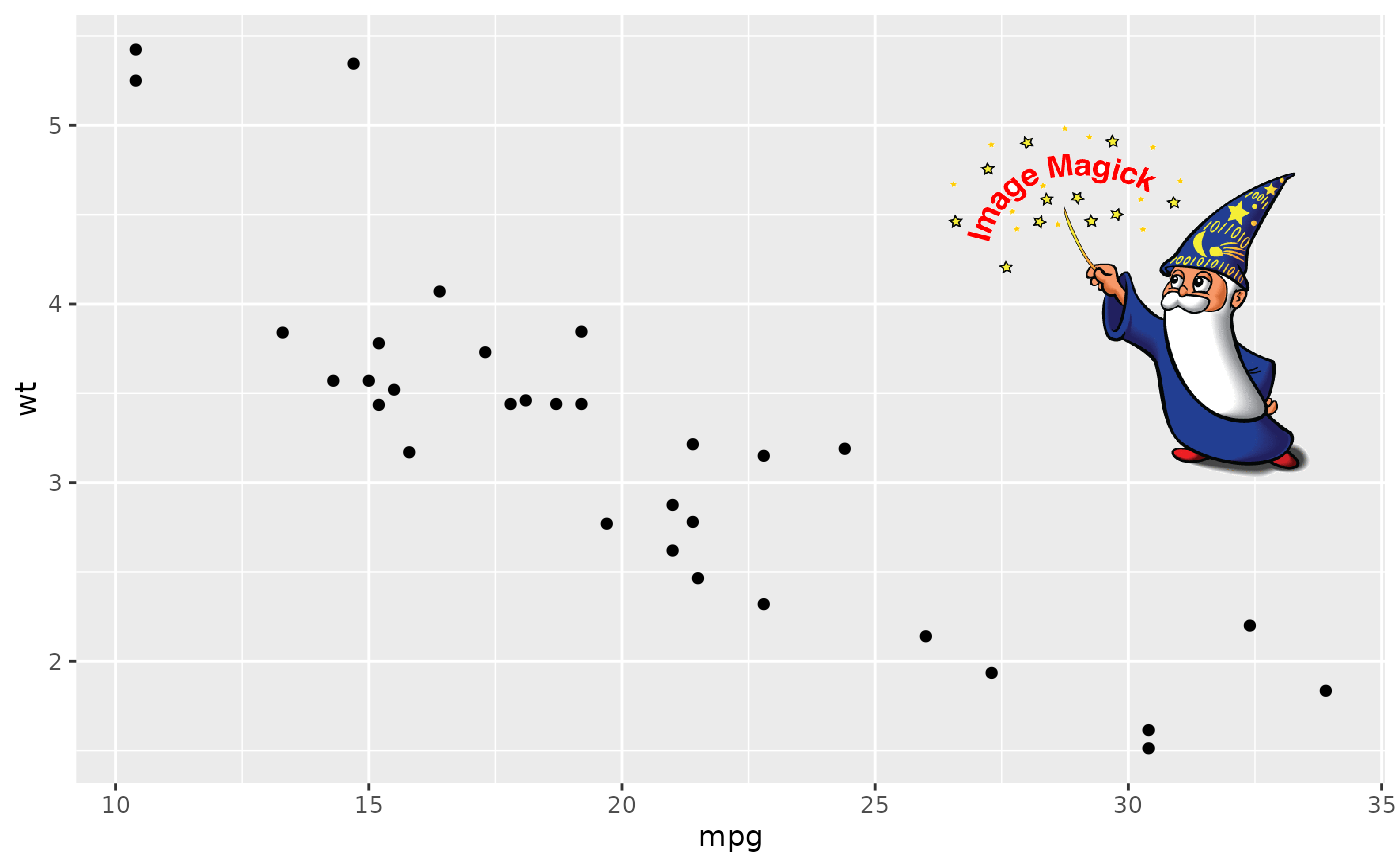
 # Or add to plot as annotation
image <- image_fill(logo, 'none')
raster <- as.raster(image)
myplot <- ggplot(mtcars, aes(mpg, wt)) + geom_point()
myplot + annotation_raster(raster, 25, 35, 3, 5)
# Or add to plot as annotation
image <- image_fill(logo, 'none')
raster <- as.raster(image)
myplot <- ggplot(mtcars, aes(mpg, wt)) + geom_point()
myplot + annotation_raster(raster, 25, 35, 3, 5)
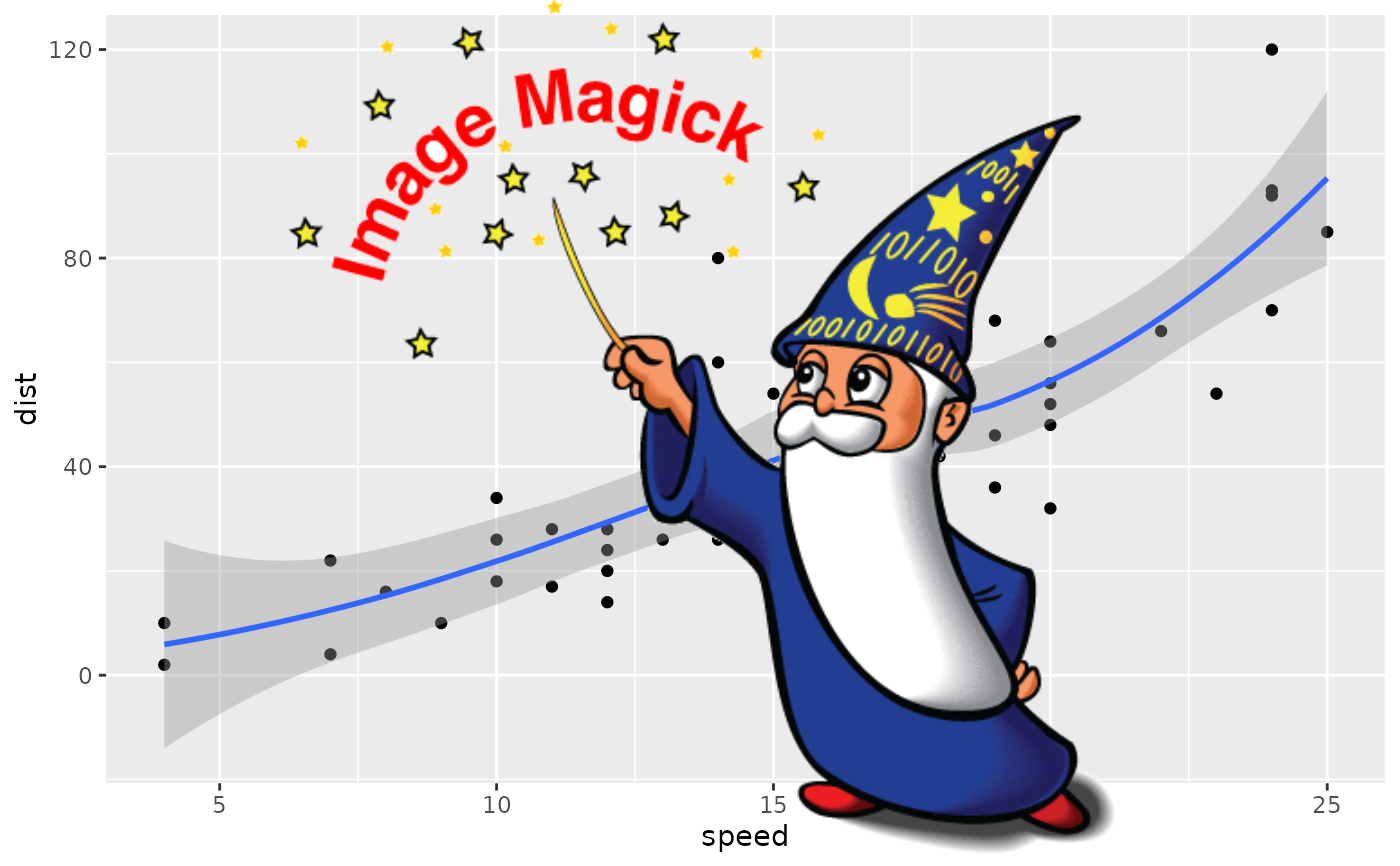
 # Or overplot image using grid
library(grid)
ggplot(cars, aes(speed, dist)) + geom_point() + geom_smooth()
#> `geom_smooth()` using method = 'loess' and formula = 'y ~ x'
grid.raster(image)
# Or overplot image using grid
library(grid)
ggplot(cars, aes(speed, dist)) + geom_point() + geom_smooth()
#> `geom_smooth()` using method = 'loess' and formula = 'y ~ x'
grid.raster(image)