This function adds a label to the line that represents a rule on a plot
created by plot_rgb_plane().
Usage
label_rule(rule, label = "", shift = c(0, 0), ...)Arguments
- rule
an object of class
pixel_rule.- label
a string to label the line. It is attached at the coordinates of the start (first point) of the line.
- shift
a numeric vector to set the displacement of the label from the start of the line. Expressed in graph units, defaults to c(0, 0).
- ...
additional graphical parameters passed to the underlying
graphics::text()function.
Details
The function uses the information stored in the pixel_rule object to
plot the label at the start of the line. The shift values, expressed
in plot coordinates, are added to the coordinates of that point to place
the label elsewhere. Note that ... can be used to pass values for the
adj parameter to the underlying graphics::text() function,
which also modifies the position of the label.
Use a character string understood by grDevices::col2rgb() to set
the colour of the label.
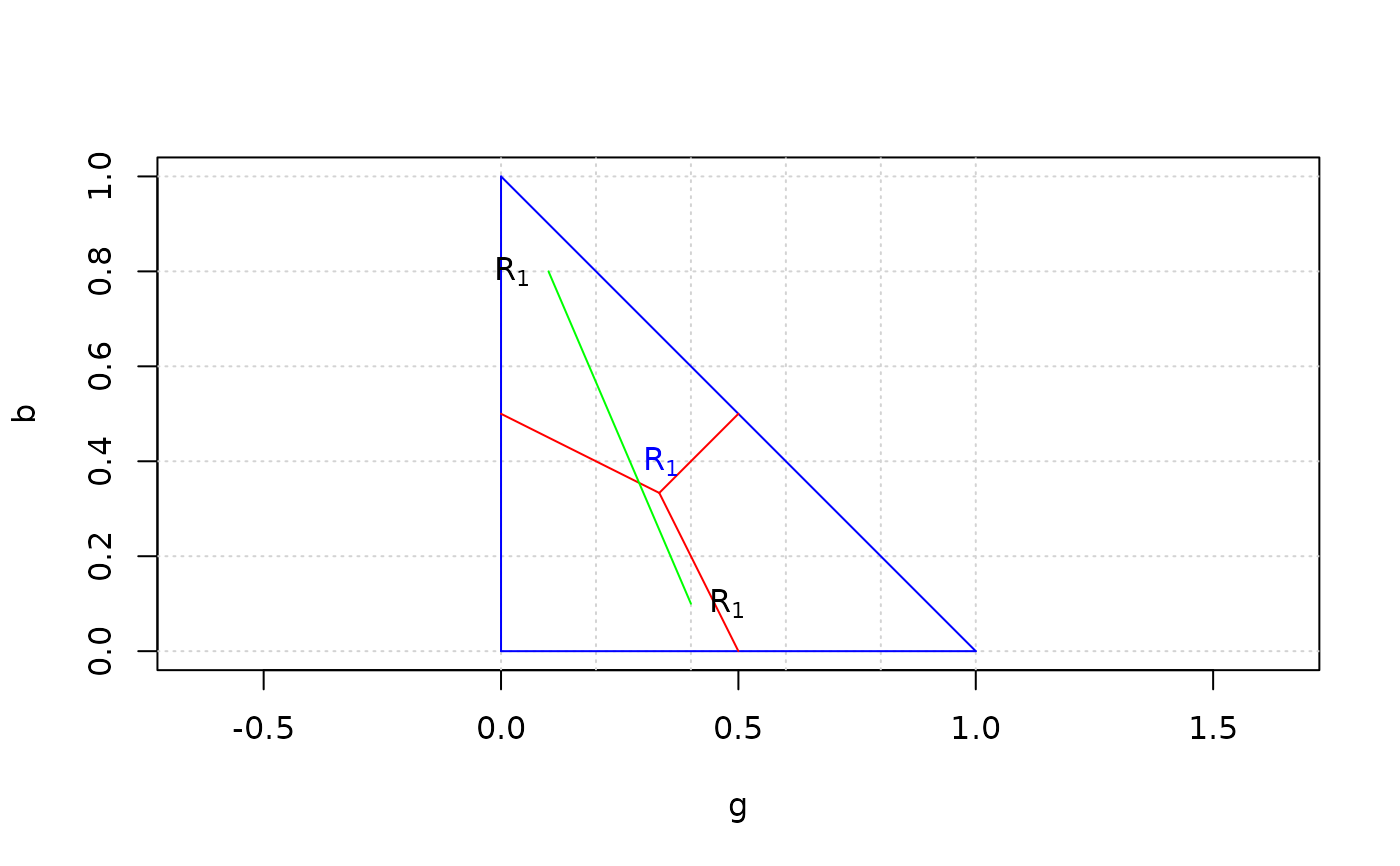
Examples
rule_01 <- define_rule("rule_01", "g", "b",
                       list(c(0.1, 0.8), c(0.40, 0.10)), "<")
plot_rgb_plane("g", "b")

# The rule is represented as a green line
plot_rule(rule_01, col = "green")

# And the label is added in three different positions by passing col and adj
# to the underlying function
label_rule(rule_01, label = expression('R'[1]*''), shift = c(0,0),
           col = 'black', adj = 1.5)
label_rule(rule_01, label = expression('R'[1]*''), shift = c(0.2, -0.4),
           col = 'blue', adj = 0)
label_rule(rule_01, label = expression('R'[1]*''), shift = c(0.3, -0.7),
           col = 'black', adj = -0.5)