Plots abundances obtained during simulation.
Usage
# S3 method for class 'sim_results'
plot(x, template = NULL, time_points = NULL, range, type, ...)
Arguments
- x
sim_resultsobject; returned bysim- template
SpatRasterobject; can be used as a template to create returned object- time_points
numeric vector; specifies points in time from which plots will be generated
- range
numeric vector of length 2; range of values to be used for the legend (if
type = "continuous"), which by default is calculated from the N_map slot ofsim_resultobject- type
character vector of length 1; type of map: "continuous" (default), "classes" or "interval" (case-sensitive)
- ...
further arguments passed to
terra::plot
Value
SpatRaster object with as many layers
as the length of time_points parameter
Examples
library(terra)
n1_small <- rast(system.file("input_maps/n1_small.tif", package = "rangr"))
K_small <- rast(system.file("input_maps/K_small.tif", package = "rangr"))
sim_data <- initialise(
n1_map = n1_small,
K_map = K_small,
r = log(2),
rate = 1 / 1e3
)
sim_res <- sim(sim_data, time = 10)
plot(sim_res)
#> Warning: No template provided. Returned SpatRaster lacks geographical information (you can use one of the input maps from the sim_data object as template)
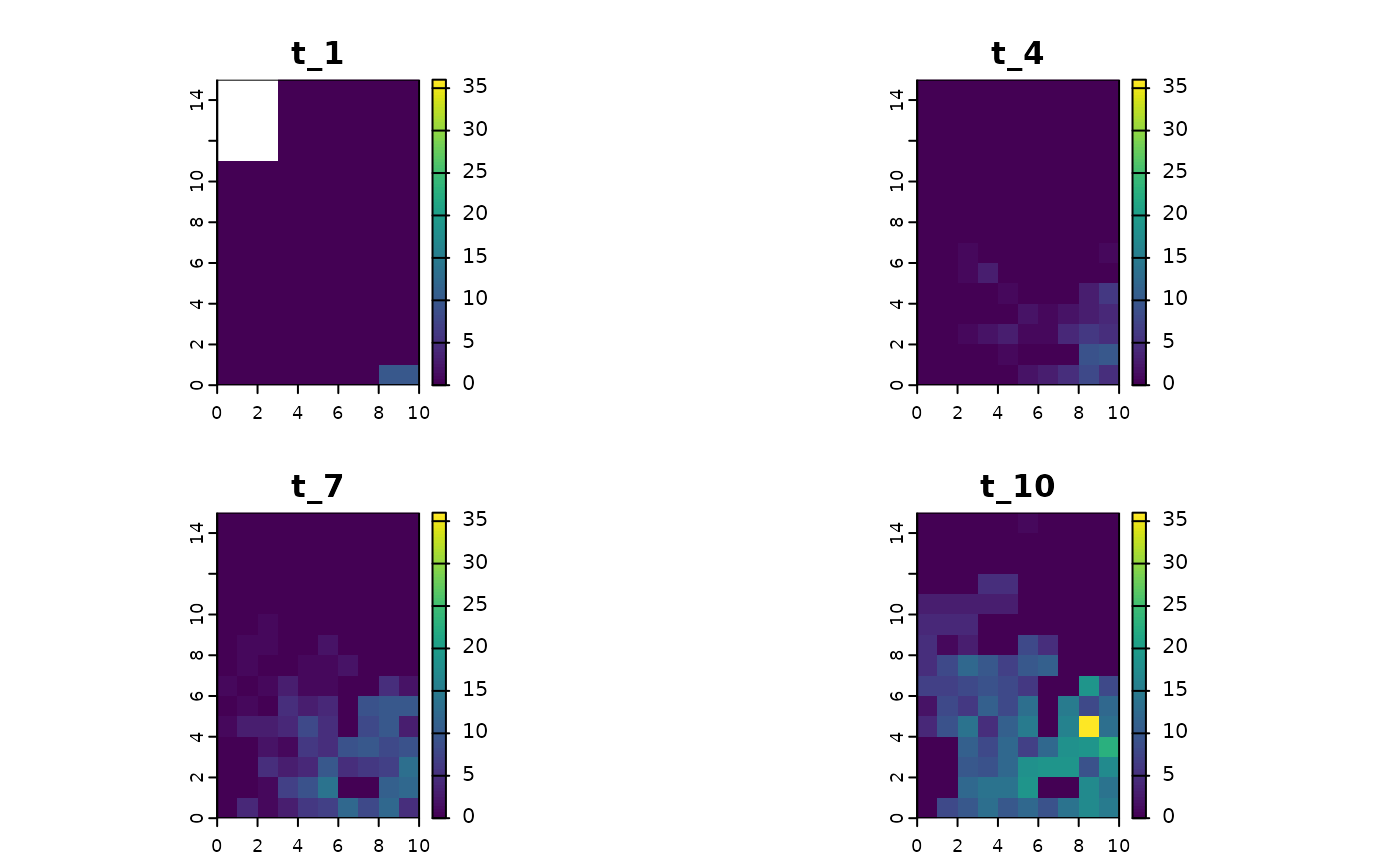 #> class : SpatRaster
#> size : 15, 10, 4 (nrow, ncol, nlyr)
#> resolution : 1, 1 (x, y)
#> extent : 0, 10, 0, 15 (xmin, xmax, ymin, ymax)
#> coord. ref. :
#> source(s) : memory
#> names : t_1, t_4, t_7, t_10
#> min values : 0, 0, 0, 0
#> max values : 10, 7, 10, 19
plot(sim_res, template = n1_small, time_points = c(1, 10))
#> class : SpatRaster
#> size : 15, 10, 4 (nrow, ncol, nlyr)
#> resolution : 1, 1 (x, y)
#> extent : 0, 10, 0, 15 (xmin, xmax, ymin, ymax)
#> coord. ref. :
#> source(s) : memory
#> names : t_1, t_4, t_7, t_10
#> min values : 0, 0, 0, 0
#> max values : 10, 7, 10, 19
plot(sim_res, template = n1_small, time_points = c(1, 10))
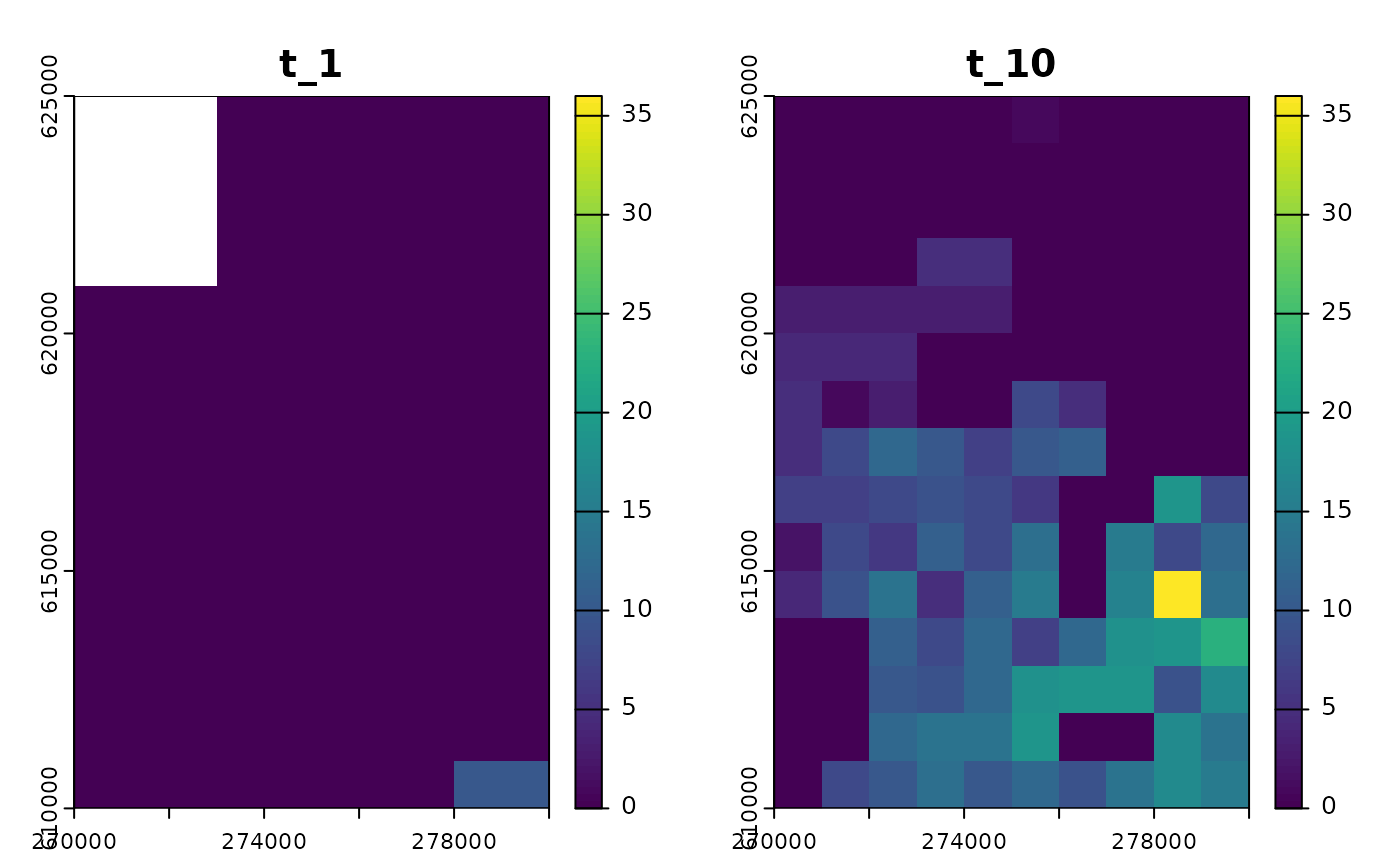 #> class : SpatRaster
#> size : 15, 10, 2 (nrow, ncol, nlyr)
#> resolution : 1000, 1000 (x, y)
#> extent : 270000, 280000, 610000, 625000 (xmin, xmax, ymin, ymax)
#> coord. ref. : ETRS89 / Poland CS92
#> source(s) : memory
#> names : t_1, t_10
#> min values : 0, 0
#> max values : 10, 19
# plot specific area
plot(sim_res, xlim = c(4, 10), ylim = c(0, 10))
#> Warning: No template provided. Returned SpatRaster lacks geographical information (you can use one of the input maps from the sim_data object as template)
#> class : SpatRaster
#> size : 15, 10, 2 (nrow, ncol, nlyr)
#> resolution : 1000, 1000 (x, y)
#> extent : 270000, 280000, 610000, 625000 (xmin, xmax, ymin, ymax)
#> coord. ref. : ETRS89 / Poland CS92
#> source(s) : memory
#> names : t_1, t_10
#> min values : 0, 0
#> max values : 10, 19
# plot specific area
plot(sim_res, xlim = c(4, 10), ylim = c(0, 10))
#> Warning: No template provided. Returned SpatRaster lacks geographical information (you can use one of the input maps from the sim_data object as template)
 #> class : SpatRaster
#> size : 15, 10, 4 (nrow, ncol, nlyr)
#> resolution : 1, 1 (x, y)
#> extent : 0, 10, 0, 15 (xmin, xmax, ymin, ymax)
#> coord. ref. :
#> source(s) : memory
#> names : t_1, t_4, t_7, t_10
#> min values : 0, 0, 0, 0
#> max values : 10, 7, 10, 19
plot(sim_res, ext = c(4, 10, 0, 10))
#> Warning: No template provided. Returned SpatRaster lacks geographical information (you can use one of the input maps from the sim_data object as template)
#> class : SpatRaster
#> size : 15, 10, 4 (nrow, ncol, nlyr)
#> resolution : 1, 1 (x, y)
#> extent : 0, 10, 0, 15 (xmin, xmax, ymin, ymax)
#> coord. ref. :
#> source(s) : memory
#> names : t_1, t_4, t_7, t_10
#> min values : 0, 0, 0, 0
#> max values : 10, 7, 10, 19
plot(sim_res, ext = c(4, 10, 0, 10))
#> Warning: No template provided. Returned SpatRaster lacks geographical information (you can use one of the input maps from the sim_data object as template)
 #> class : SpatRaster
#> size : 15, 10, 4 (nrow, ncol, nlyr)
#> resolution : 1, 1 (x, y)
#> extent : 0, 10, 0, 15 (xmin, xmax, ymin, ymax)
#> coord. ref. :
#> source(s) : memory
#> names : t_1, t_4, t_7, t_10
#> min values : 0, 0, 0, 0
#> max values : 10, 7, 10, 19
plot(sim_res, template = n1_small, ext = c(274000, 280000, 610000, 620000))
#> class : SpatRaster
#> size : 15, 10, 4 (nrow, ncol, nlyr)
#> resolution : 1, 1 (x, y)
#> extent : 0, 10, 0, 15 (xmin, xmax, ymin, ymax)
#> coord. ref. :
#> source(s) : memory
#> names : t_1, t_4, t_7, t_10
#> min values : 0, 0, 0, 0
#> max values : 10, 7, 10, 19
plot(sim_res, template = n1_small, ext = c(274000, 280000, 610000, 620000))
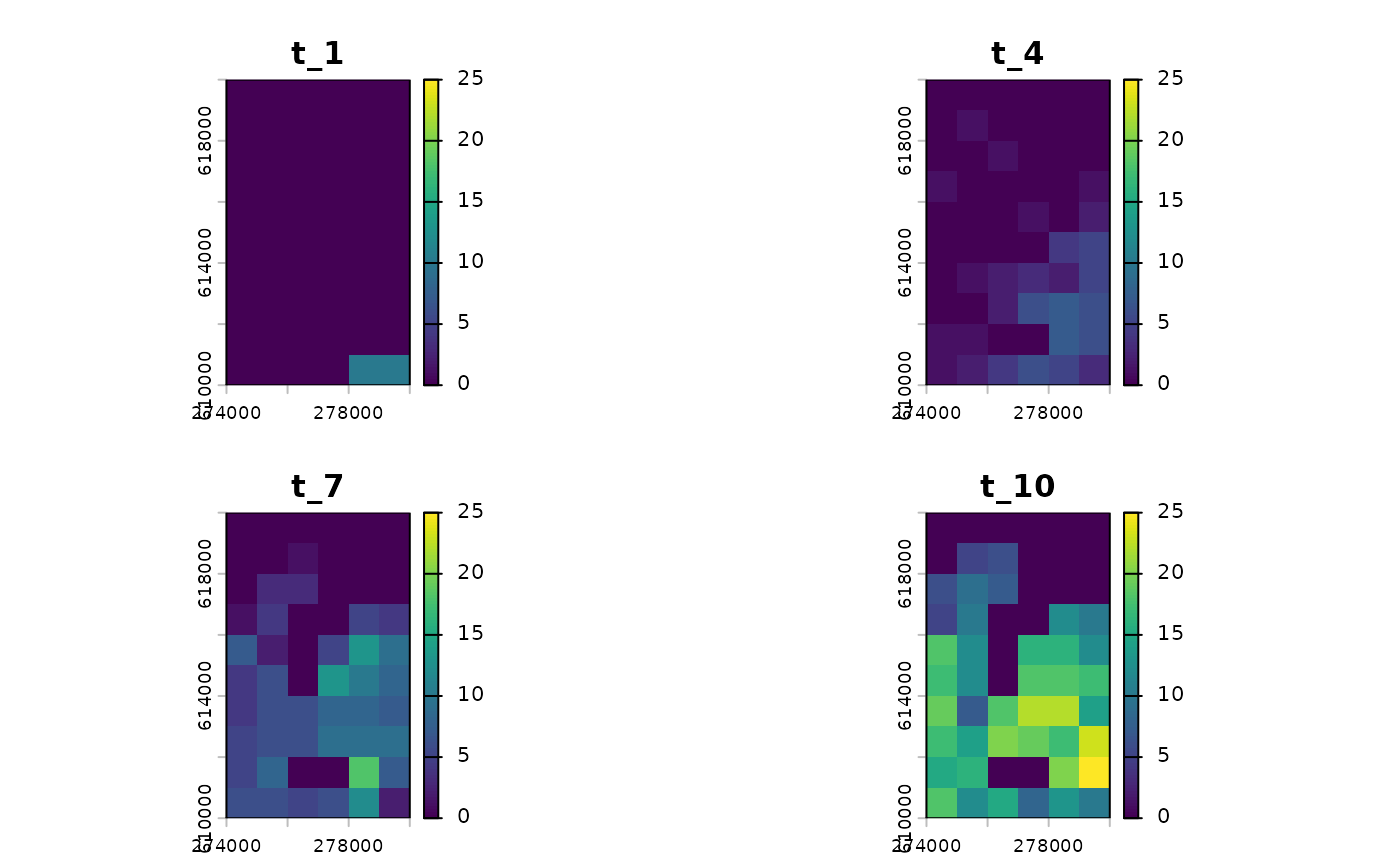 #> class : SpatRaster
#> size : 15, 10, 4 (nrow, ncol, nlyr)
#> resolution : 1000, 1000 (x, y)
#> extent : 270000, 280000, 610000, 625000 (xmin, xmax, ymin, ymax)
#> coord. ref. : ETRS89 / Poland CS92
#> source(s) : memory
#> names : t_1, t_4, t_7, t_10
#> min values : 0, 0, 0, 0
#> max values : 10, 7, 10, 19
#> class : SpatRaster
#> size : 15, 10, 4 (nrow, ncol, nlyr)
#> resolution : 1000, 1000 (x, y)
#> extent : 270000, 280000, 610000, 625000 (xmin, xmax, ymin, ymax)
#> coord. ref. : ETRS89 / Poland CS92
#> source(s) : memory
#> names : t_1, t_4, t_7, t_10
#> min values : 0, 0, 0, 0
#> max values : 10, 7, 10, 19