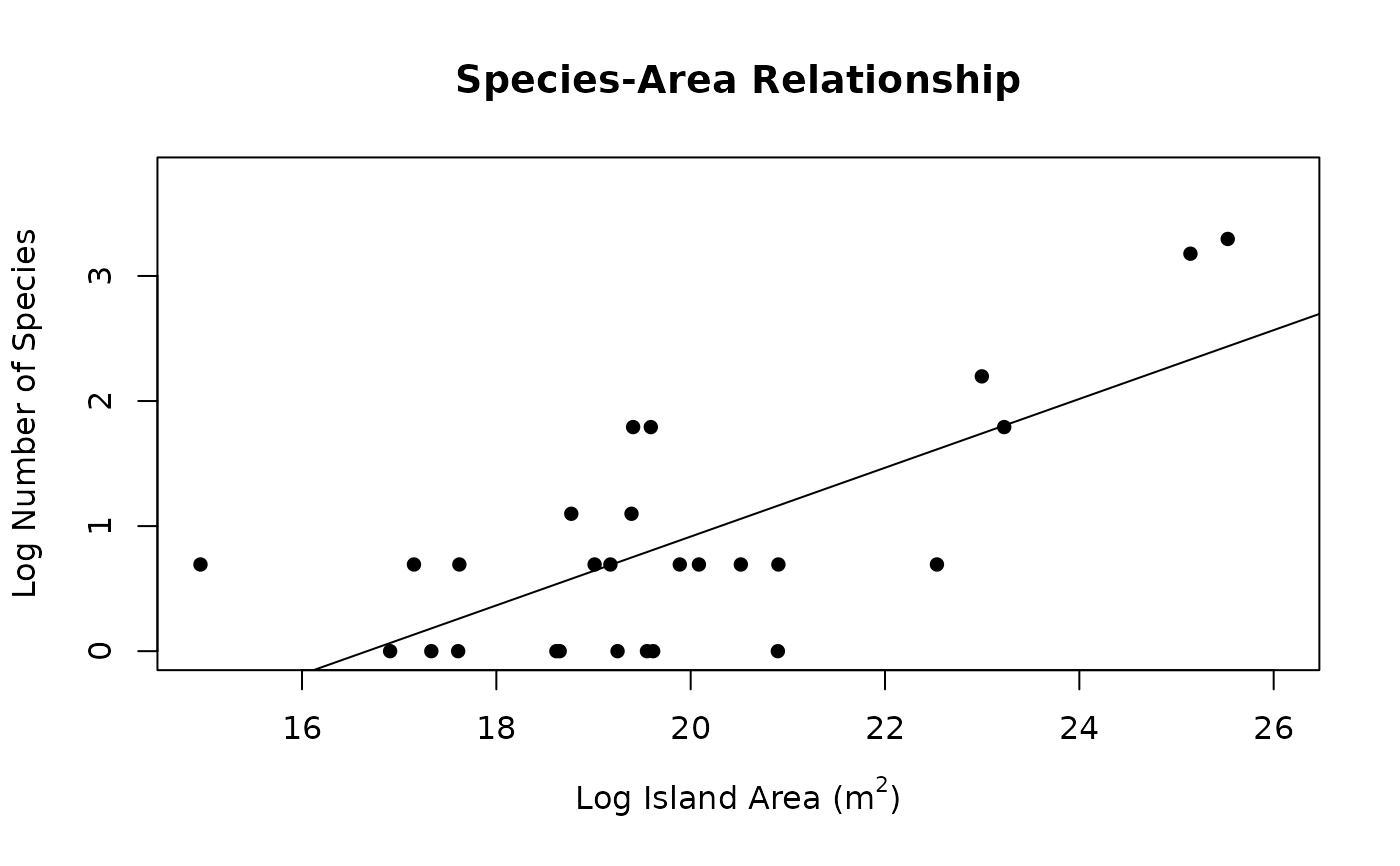
Function for plotting species-area relationship objects from the
ssarp::create_SAR() function
Usage
# S3 method for class 'SAR'
plot(x, ...)Examples
# The GBIF key for the Anolis genus is 8782549
# Read in example dataset filtered from:
#  dat <- rgbif::occ_search(taxonKey = 8782549,
#                           hasCoordinate = TRUE,
#                           limit = 10000)
dat <- read.csv(system.file("extdata",
                            "ssarp_Example_Dat.csv",
                            package = "ssarp"))
occs <- find_land(occurrences = dat)
areas <- find_areas(occs = occs)
#> ℹ Recording island names...
#> ℹ Assembling island dictionary...
#> ℹ Adding areas to final dataframe...
seg <- create_SAR(areas, npsi = 0)
plot(seg)