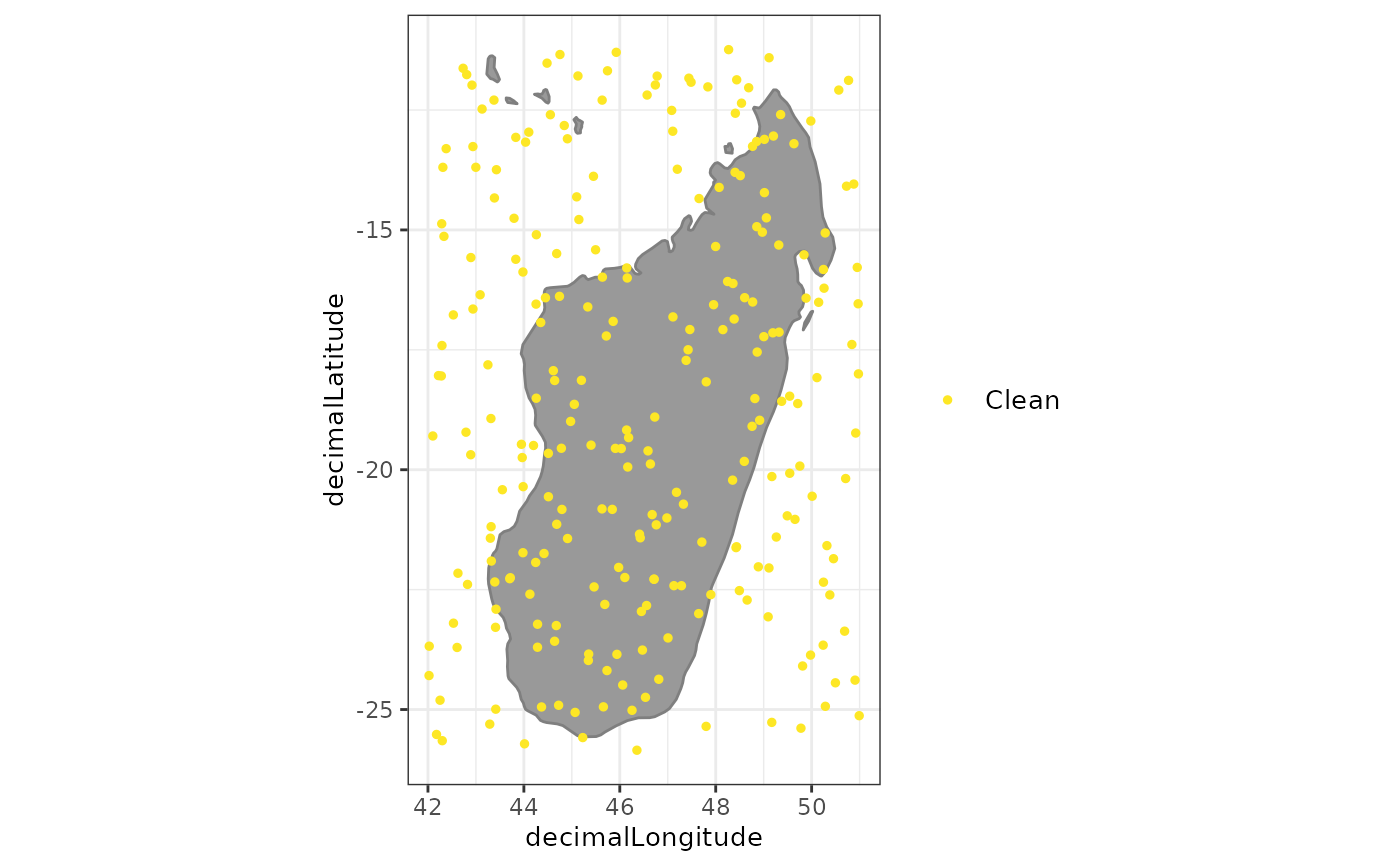
A set of plots to explore objects of the class spatialvalid. A plot
to visualize the flags from clean_coordinates
Usage
# S3 method for class 'spatialvalid'
plot(
  x,
  lon = "decimalLongitude",
  lat = "decimalLatitude",
  bgmap = NULL,
  clean = TRUE,
  details = FALSE,
  pts_size = 1,
  font_size = 10,
  zoom_f = 0.1,
  ...
)
Arguments
- x
an object of the class
spatialvalidas fromclean_coordinates.- lon
character string. The column with the longitude coordinates. Default = “decimalLongitude”.
- lat
character string. The column with the latitude coordinates. Default = “decimalLatitude”.
- bgmap
an object of the class
SpatVectororsfused as background map. Default = ggplot::borders()- clean
logical. If TRUE, non-flagged coordinates are included in the map.
- details
logical. If TRUE, occurrences are color-coded by the type of flag.
- pts_size
numeric. The point size for the plot.
- font_size
numeric. The font size for the legend and axes
- zoom_f
numeric. the fraction by which to expand the plotting area from the occurrence records. Increase, if countries do not show up on the background map.
- ...
arguments to be passed to methods.
Value
A plot of the records flagged as potentially erroneous by
clean_coordinates.
Examples
exmpl <- data.frame(species = sample(letters, size = 250, replace = TRUE),
                    decimalLongitude = runif(250, min = 42, max = 51),
                    decimalLatitude = runif(250, min = -26, max = -11))

test <- clean_coordinates(exmpl, species = "species",
                          tests = c("sea", "gbif", "zeros"),
                          verbose = FALSE)
#> Warning: [vect] guessed crs

summary(test)
#>     .val     .zer     .gbf .summary
#>        0        0        0        0
plot(test)
#> Warning: `aes_string()` was deprecated in ggplot2 3.0.0.
#> ℹ Please use tidy evaluation idioms with `aes()`.
#> ℹ See also `vignette("ggplot2-in-packages")` for more information.
#> ℹ The deprecated feature was likely used in the CoordinateCleaner package.
#>   Please report the issue at
#>   <https://github.com/ropensci/CoordinateCleaner/issues>.