project the model response values back into your scale of interest (spike, deltaF/F...)
Usage
back_project(template.data, responding.unit,
  response_matrix = door_default_values("door_response_matrix"))
Arguments
- template.data
data frame, the data that provides the scale to transform to, containing InChIKeys in a column called "odorants" and responses in a column called "responses"
- responding.unit
character, the name of the receptor/OSN/glomerulus which responses should be transformed
- response_matrix
DoOR response matrix, the source data is picked from here
Value
Output of back_project is a list containing a data frame with the back_projected data, the original data, the data used as a template and the data that resulted from fitting source and template (before rescaling to the template scale). additionaly the parameters of the linear fit between the source and template response scale is returned.
Details
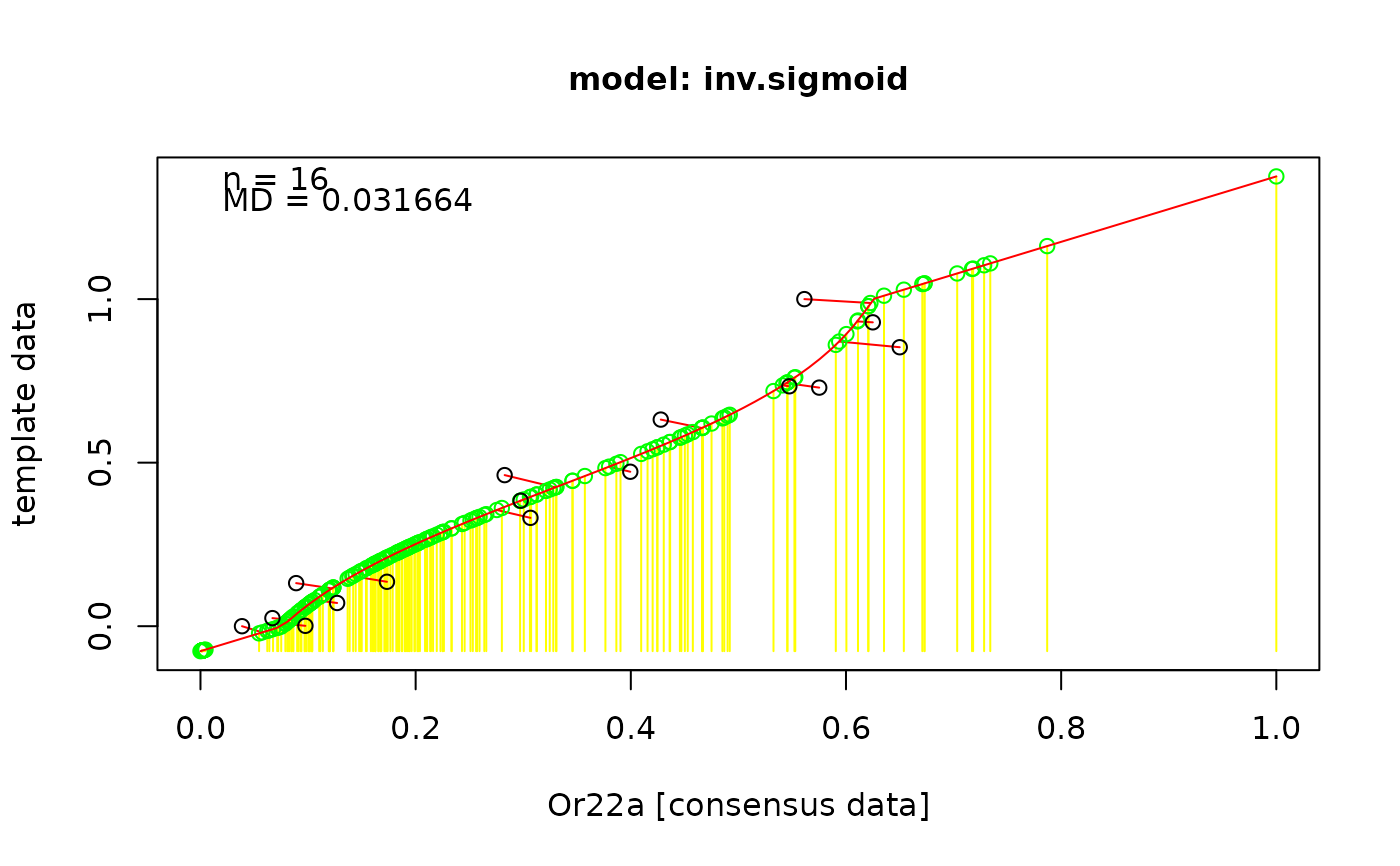
The process of back projection is the following:
1. rescale both data sets to [0,1],
2. find the best fitting model between "bp.data" and "cons.data" (lowest MD value),
3. project the consensus data onto the fitted curv, these are now our normalized, back projected responses
4. rescale all responses to the scale of the original data via a linear fit.
Examples
# load some data sets
data(Or22a)
data(door_response_matrix)

# create example data we are going to back project
template.data <- data.frame(odorants = Or22a$InChIKey,
                            responses = Or22a$Hallem.2004.EN)

# run back_project and plot the results
bp <- back_project(template.data, "Or22a")
#> Warning: selfStart initializing functions should have a final '...' argument since R 4.1.0
#> Warning: selfStart initializing functions should have a final '...' argument since R 4.1.0


plot(bp$back_projected$original.data,
     bp$back_projected$back_projected.data,
     xlab = "DoOR consensus response",
     ylab = "back_projected data [spikes, Hallem.2004.EN]"
)

