plot the activation patterns of one or several odorants across OSNs
Usage
dplot_across_osns(
  odorants,
  response_matrix = door_default_values("door_response_matrix"),
  odor_data = door_default_values("odor"),
  door_mappings = door_default_values("door_mappings"),
  zero = door_default_values("zero"),
  tag = "Name",
  sub,
  plot.type = 1,
  base_size = 12
)
Arguments
- odorants
character vector, one or several InChIKeys
- response_matrix
DOOR response matrix, contains the data to plot
- odor_data
data frame, contains the odorant information.
- door_mappings
data frame, containing the mappings of response profiles to morphological structures.
- zero
character, InChIKey of the odorant that should be set to 0 (e.g. SFR)
- tag
character, the chemical identifier to use in the plot, one of
colnames(odor)- sub
character vector, specify one or several classes of sensilla the plot should be restricted to. One or several of: "ab" "ac", "at", "ai", "pb", "sacI", "sacII"
- plot.type
interger, 1 or 2, defining the type of plot (1: facet_grid of odorants * sensillae, 2: facet_wrap across OSNs)
- base_size
numeric, the base font size for the ggplot2 plot
Details
DoOR response profiles will be selected and ordered according to the
OSNs they are related to. Several DoOR response profiles might exist for a
given OSN (e.g. one for the OSN itself and one for the OSNs misexpressed
receptor protein) but only one will be shown. Which DoOR profile is mapped
to which OSN is controlled via the "code.OSN" column in DoORmapings.
Author
Daniel Münch <daniel.muench@uni-konstanz.de>
Examples
# load DoOR data & functions
library(DoOR.data)
library(DoOR.functions)
# pick example odorants by name ans transform their ID to InChIKey
odorants <- trans_id(c("1-butanol", "isopentyl acetate", "carbon dioxide", "water"),
from = "Name", to = "InChIKey")
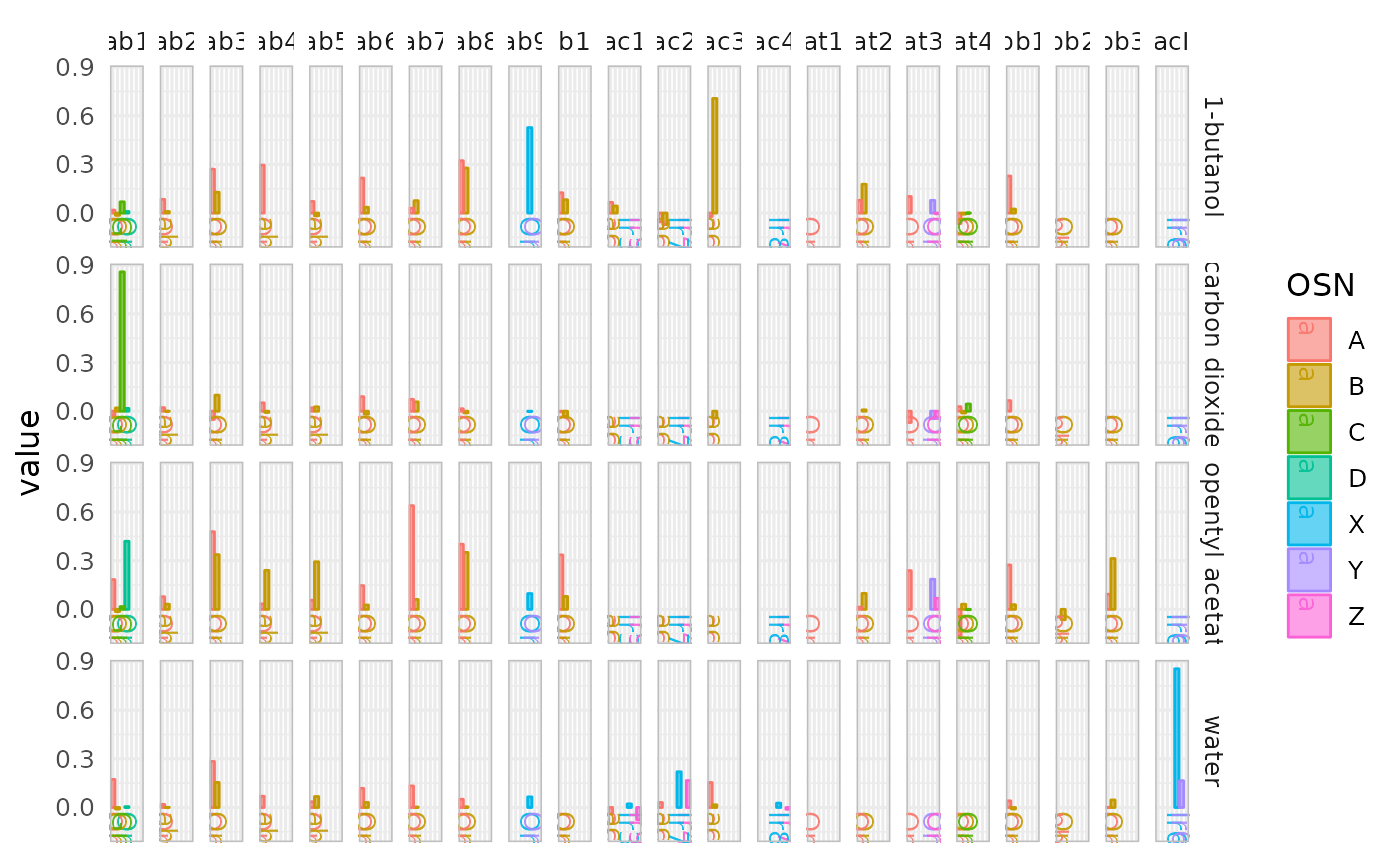
# plot
dplot_across_osns(odorants)
#> Warning: Removed 71 rows containing missing values or values outside the scale range
#> (`geom_bar()`).
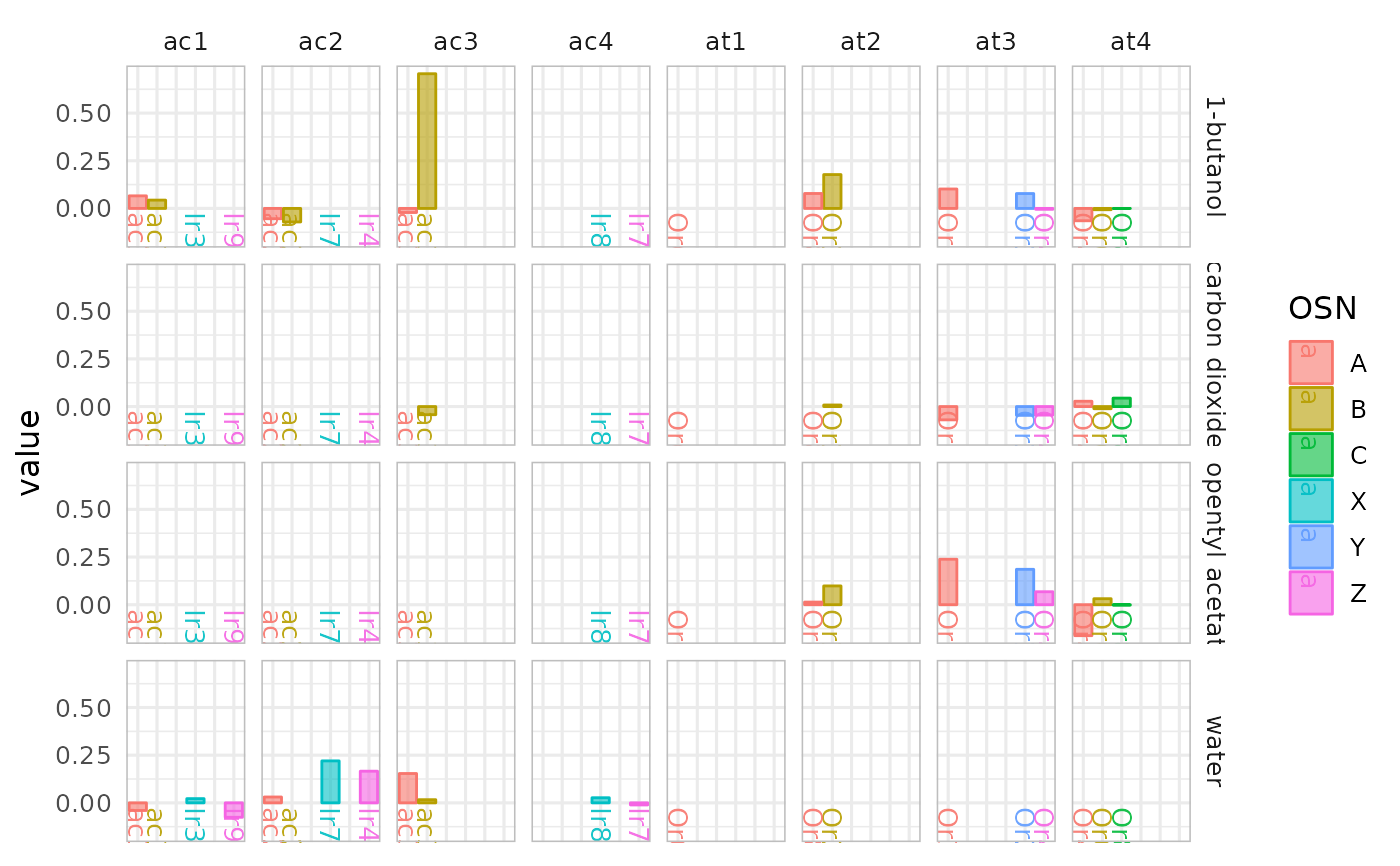
 # plot only across ac and at sensillae
dplot_across_osns(odorants, sub = c("ac", "at"))
#> Warning: Removed 44 rows containing missing values or values outside the scale range
#> (`geom_bar()`).
# plot only across ac and at sensillae
dplot_across_osns(odorants, sub = c("ac", "at"))
#> Warning: Removed 44 rows containing missing values or values outside the scale range
#> (`geom_bar()`).
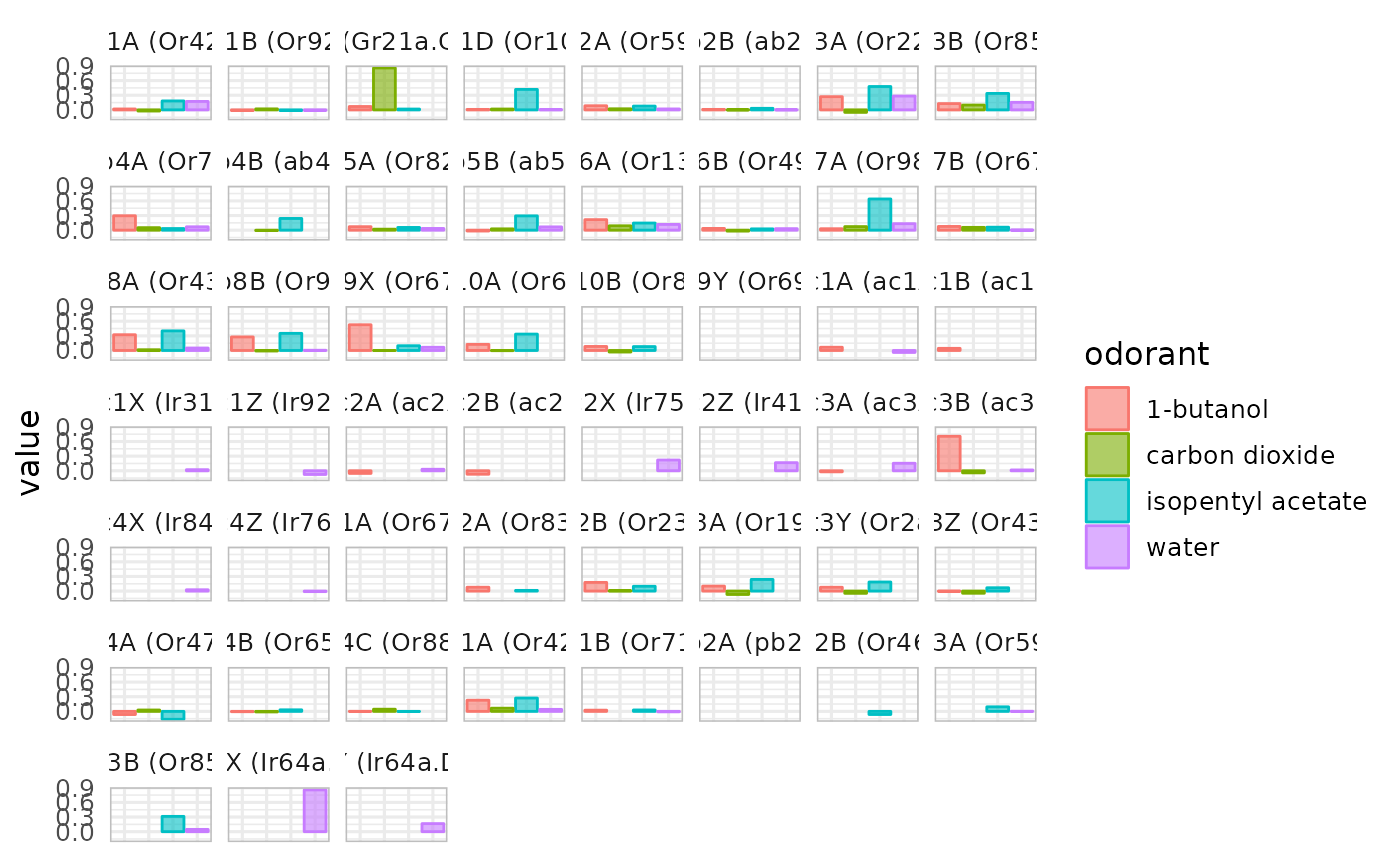
 # plot across sensory neurons
dplot_across_osns(odorants, plot.type = 2)
#> Warning: Removed 71 rows containing missing values or values outside the scale range
#> (`geom_bar()`).
# plot across sensory neurons
dplot_across_osns(odorants, plot.type = 2)
#> Warning: Removed 71 rows containing missing values or values outside the scale range
#> (`geom_bar()`).