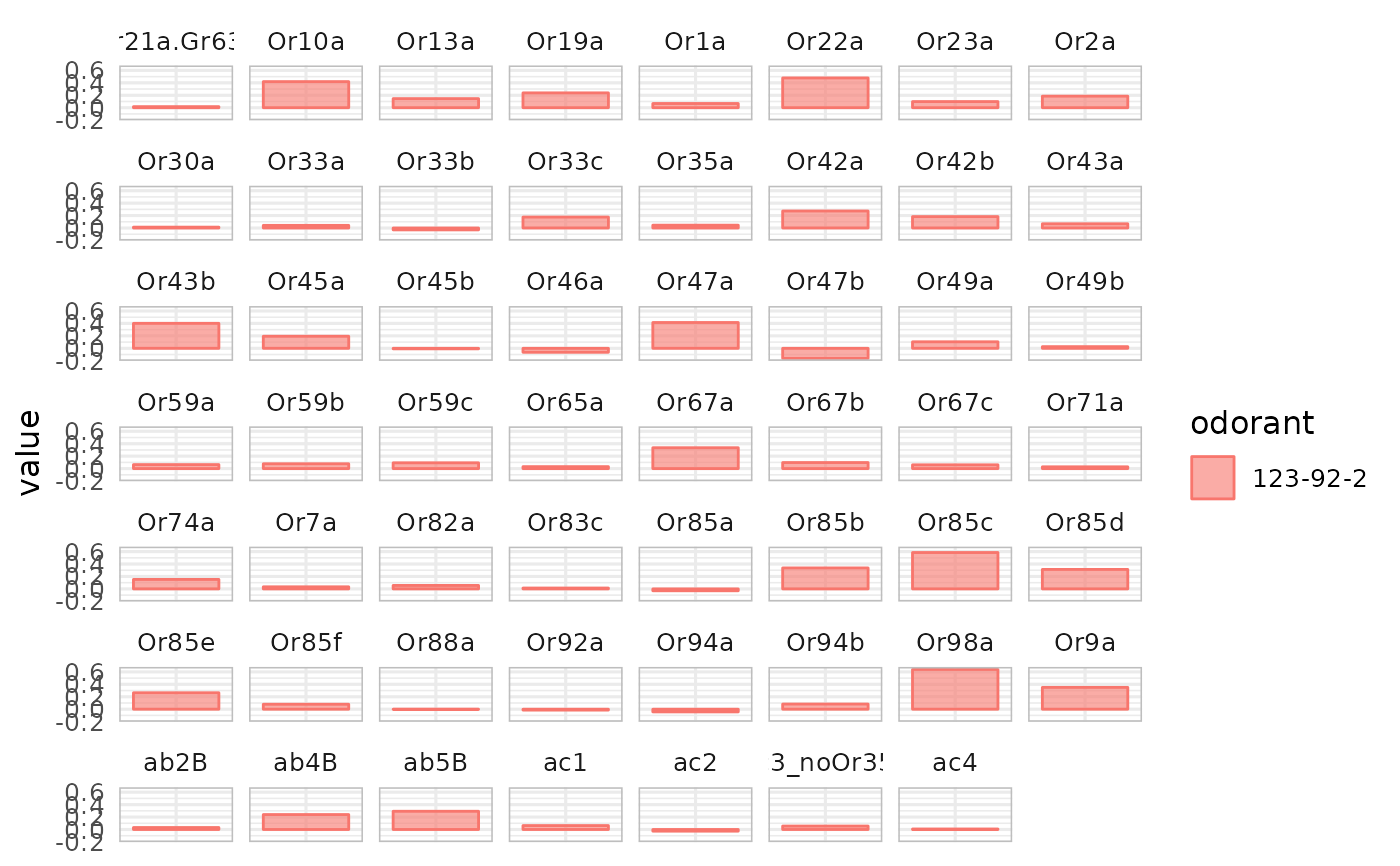
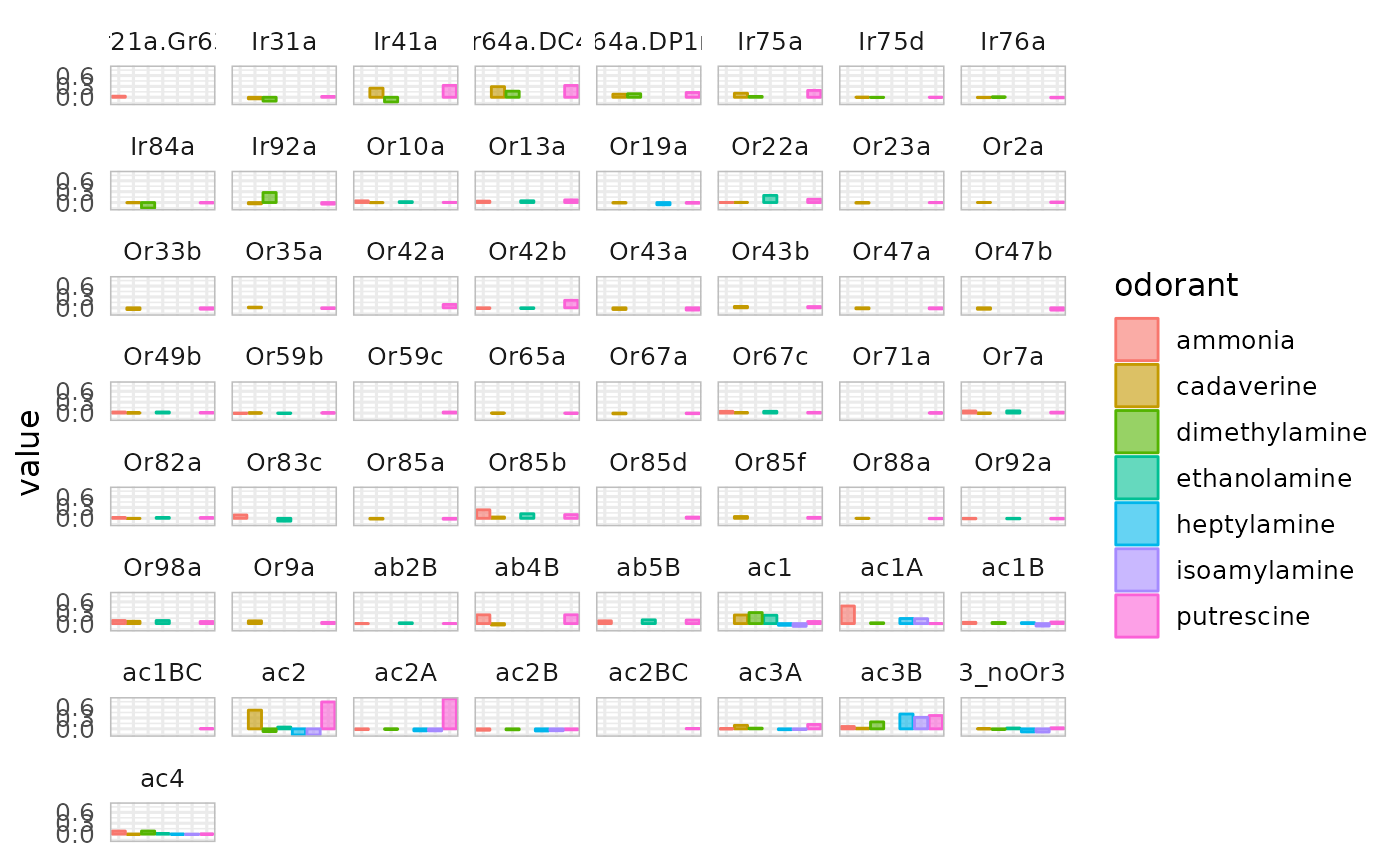
barplot of DoOR responses of a set of odorant across all responding units in DoOR
Usage
dplot_across_ru(
  odorant,
  response_matrix = door_default_values("door_response_matrix"),
  odor_data = door_default_values("odor"),
  zero = door_default_values("zero"),
  tag = "Name",
  limits,
  base_size = 12
)
Arguments
- odorant
character vecto, one or several InChIKeys
- response_matrix
DoOR response matrix, a DoOR response matrix as data source
- odor_data
data frame, contains the odorant information.
- zero
character, an InChIKey of the odorant that should be set to 0
- tag
character, the chemical identifier to plot as odorant name (one of colnames(odor))
- limits
numeric of length 2, if provided the ylim will range accordingly
- base_size
numeric, the base font size for the ggplot2 plot
Author
Daniel Münch <daniel.muench@uni-konstanz.de>