plot a receptor or odorant tuning curve
Usage
dplot_tuningCurve(
  receptor,
  odorant,
  response.vector,
  response_matrix = door_default_values("door_response_matrix"),
  odor_data = door_default_values("odor"),
  zero = door_default_values("zero"),
  fill.receptor = door_default_values("color.receptor"),
  fill.odorant = door_default_values("color.odorant"),
  odor.main = "Name",
  limits,
  base_size = 12
)
Arguments
- receptor
character, a receptor name (one of ORS$OR)
- odorant
character, an odorant name (InChIKey)
- response.vector
numerical vector, a vector with responses, if empty this is taken from door_response_matrix
- response_matrix
DoOR response matrix, response vector will be taken from here, not needed if response.vector is given
- odor_data
data frame, contains the odorant information.
- zero
InChIKey, will be set to zero, default is SFR, ignored when data is provided via response.vector, set to "" if you don't want to subtract anything
- fill.receptor
color code, bar color for receptor tuning curve
- fill.odorant
color code, bar color for odorant tuning curve
- odor.main
the odor identifier to plot, one of colnamed(odor)
- limits
the numerical vector of length 2, y limits for the tuning curve
- base_size
numeric, the base font size for the ggplot2 plot
Author
Daniel Münch <daniel.muench@uni-konstanz.de>
Examples
# load data
library(DoOR.data)
data(door_response_matrix)
data(odor)
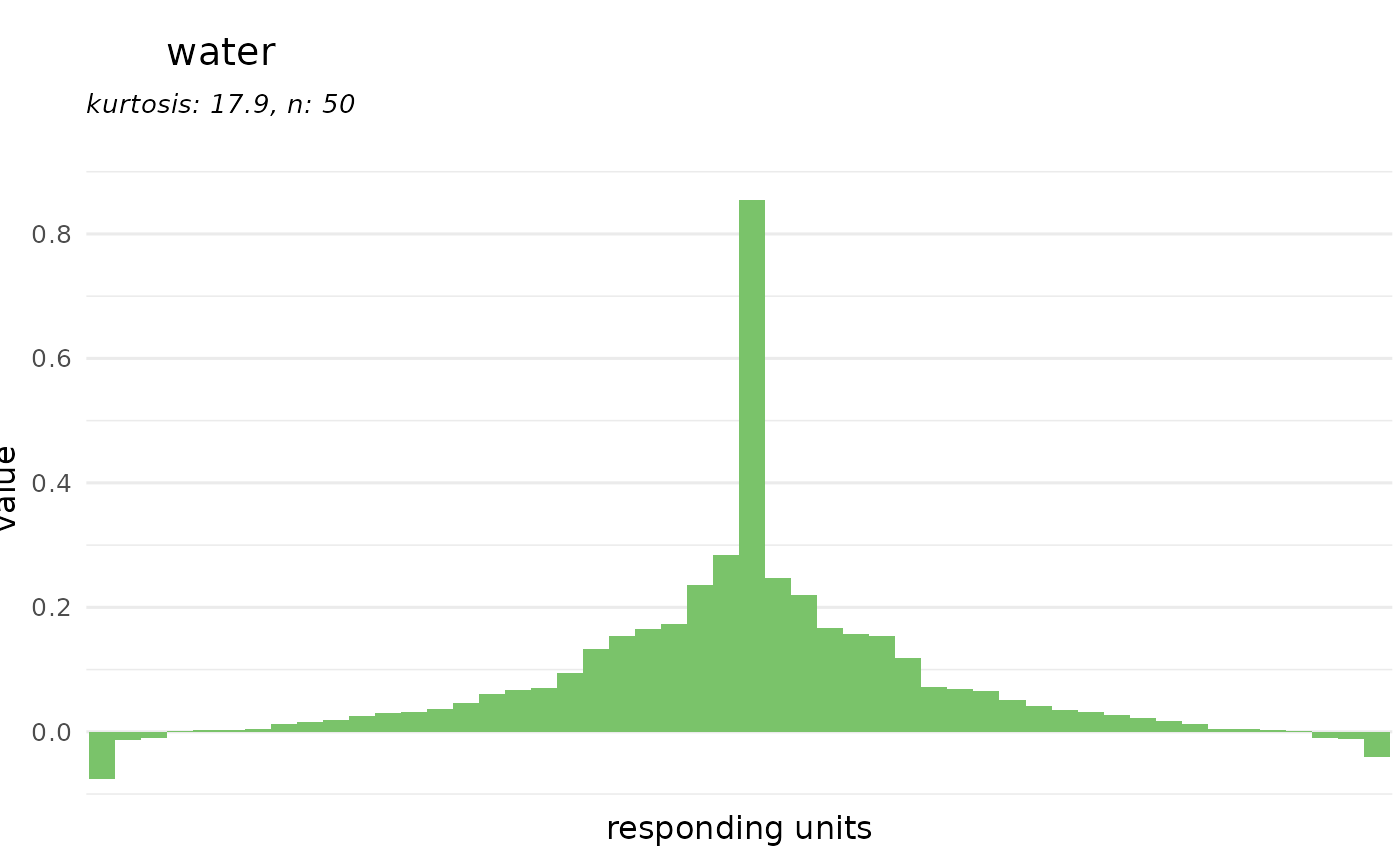
# plot a tuning curve for an odorant
dplot_tuningCurve(odorant = odor$InChIKey[2])
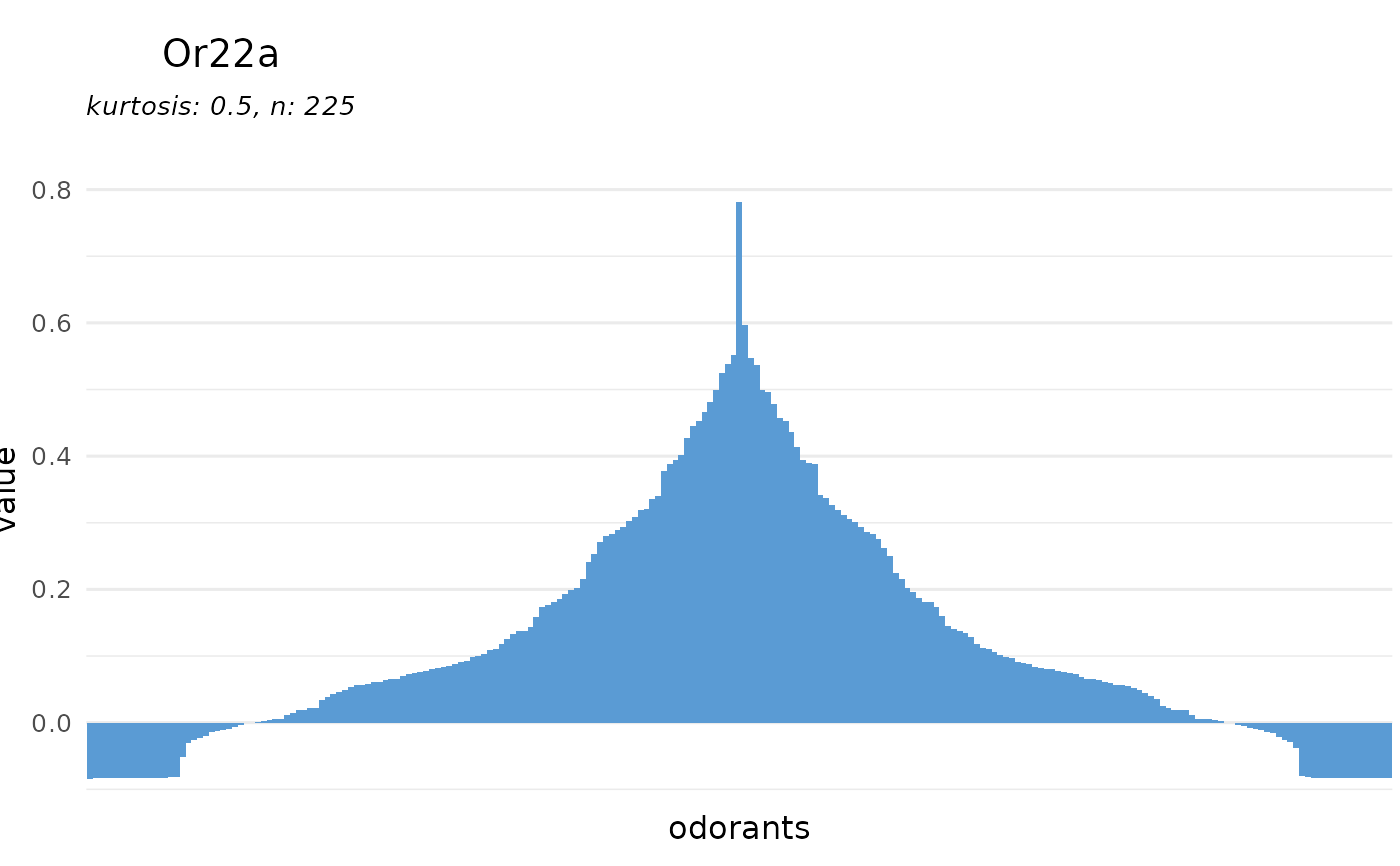
 # or for a receptor
dplot_tuningCurve(receptor = "Or22a")
# or for a receptor
dplot_tuningCurve(receptor = "Or22a")
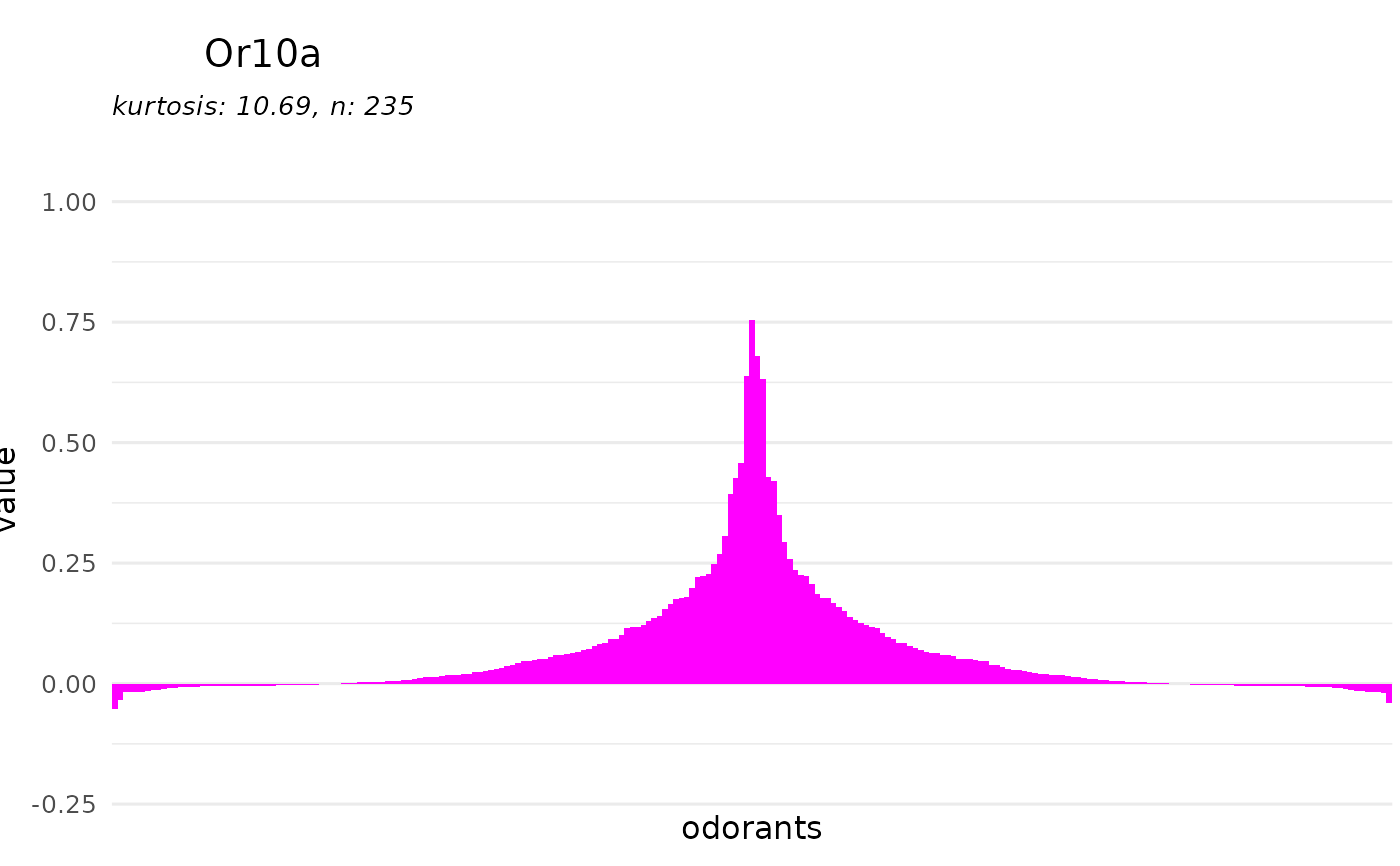
 # adjust the plotting range
range <- range(reset_sfr(door_response_matrix, "SFR"), na.rm = TRUE)
dplot_tuningCurve(receptor = "Or10a", limits = range,
fill.receptor = "magenta")
# adjust the plotting range
range <- range(reset_sfr(door_response_matrix, "SFR"), na.rm = TRUE)
dplot_tuningCurve(receptor = "Or10a", limits = range,
fill.receptor = "magenta")
 # plot with manual input data as receptor tuning curve
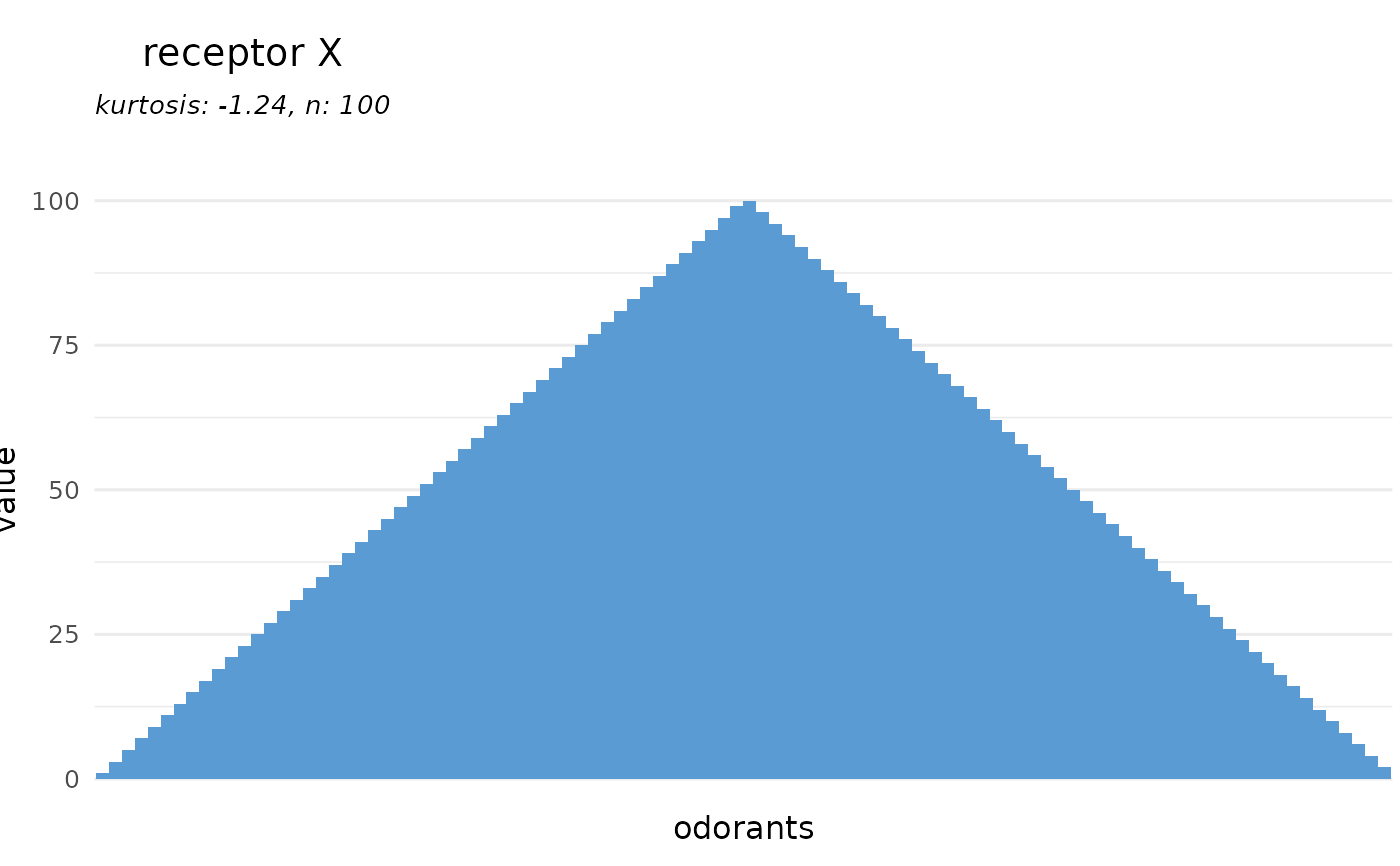
dplot_tuningCurve(receptor = "receptor X", response.vector = c(1:100))
# plot with manual input data as receptor tuning curve
dplot_tuningCurve(receptor = "receptor X", response.vector = c(1:100))
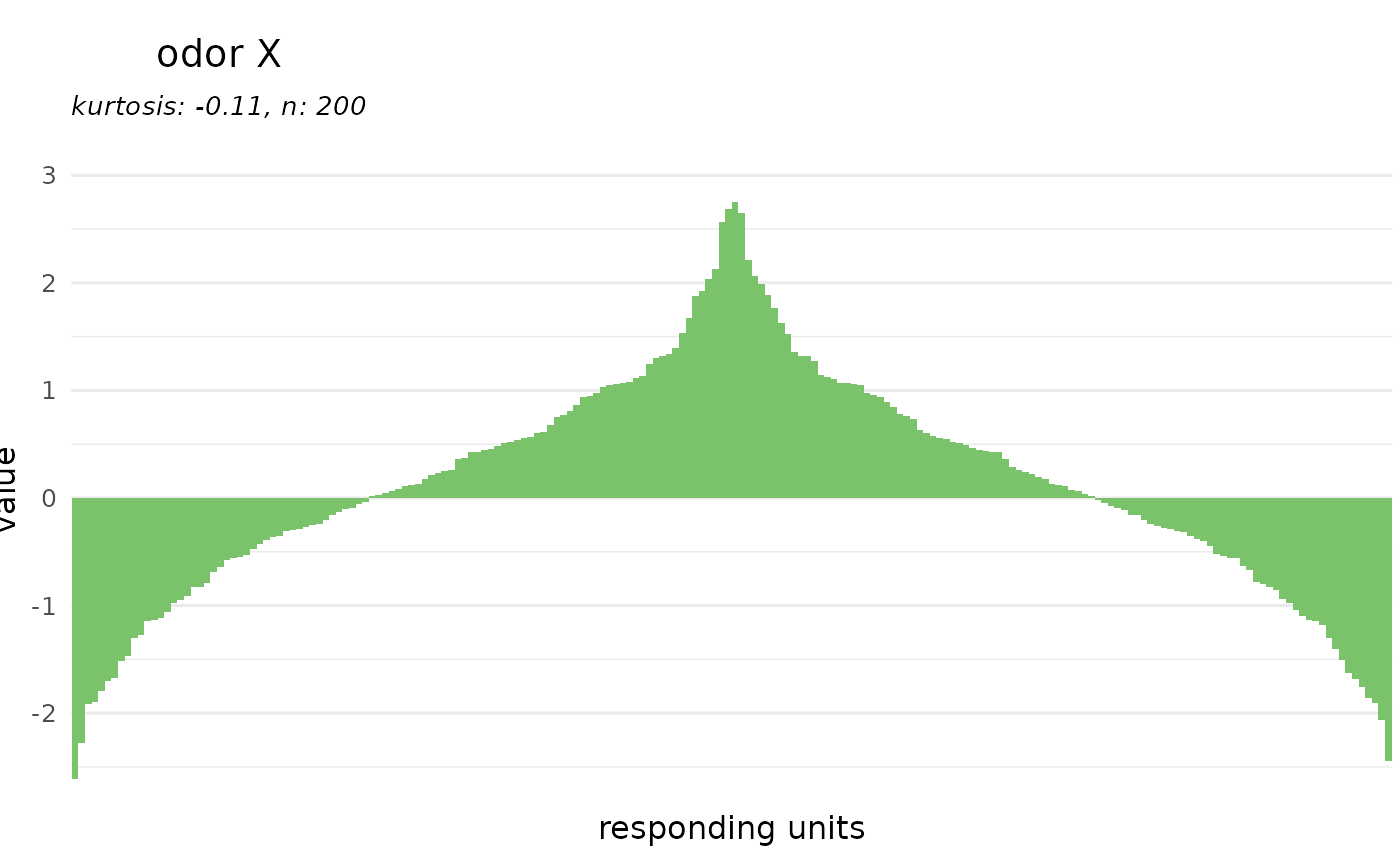
 # or as odor tuning curve
dplot_tuningCurve(odorant = "odor X", response.vector = rnorm(200))
# or as odor tuning curve
dplot_tuningCurve(odorant = "odor X", response.vector = rnorm(200))