correlates the result from a SSR recording of several odorants against all DoOR response profiles
Usage
identify_sensillum(
  recording,
  response_matrix = door_default_values("door_response_matrix"),
  odor_data = door_default_values("odor"),
  door_mappings = door_default_values("door_mappings"),
  tag = "Name",
  min.cor = 0.9,
  nshow = 10,
  method = "cor",
  sub,
  base_size = 12,
  plot = TRUE,
  use = "everything"
)
Arguments
- recording
data frame, a data frame with the following columns "odorants" containing InChIKeys of the tested odorrant, and one column called "unit1" etc. for each unit, containing responses (or estimates) scaled between 0 and 1 (see examples)
- response_matrix
DoOR response matrix, the data to compair against
- odor_data
data frame, contains the odorant information.
- door_mappings
the data frame containing the mapping information
- tag
character, the chemical identifier to use in plots, one of
colnames(odor)- min.cor
numeric, a minimum correlation value, the function will check wether there is a higher correlation for all units within a single sensillum
- nshow
numeric, the number of plots to nshow, plot e.g. only the top 10 matches
- method
character, the method for similarity calculations: correlation ("cor") or Euclidean distances ("dist")
- sub
character, if you know the class of sensillum you were recording from you can restrict the search to this subset here ("ab", "ac", "at", "pb", "sac")
- base_size
numeric, the base font size of the ggplot plots
- plot
logical, if TRUE returns the plot, else returns the data frame with the correlations/distances
- use
character, the "use" option from the
corfunction, "all" returns NA when pairs are incomplete, "na.or.complete" only uses complete observations to calculate correlations; seecorfor details
Value
eithe& Carolin G.(†27)r a plot (gtable) with responses sorted by highest correlations or lowest distances, or a data frame containing all calculated correlations or Euclidean distances
Author
Daniel Münch <daniel.muench@uni-konstanz.de>
Examples
# load data
library(DoOR.data)
# create an example recording
recording <- data.frame(
odorants = c(trans_id(c("BEDN", "ETAS"), "Code"),
trans_id("carbon dioxide", "Name")),
unit1 = c(.9,.1,.1),
unit2 = c(0, .1, 1)
)
# run the identification
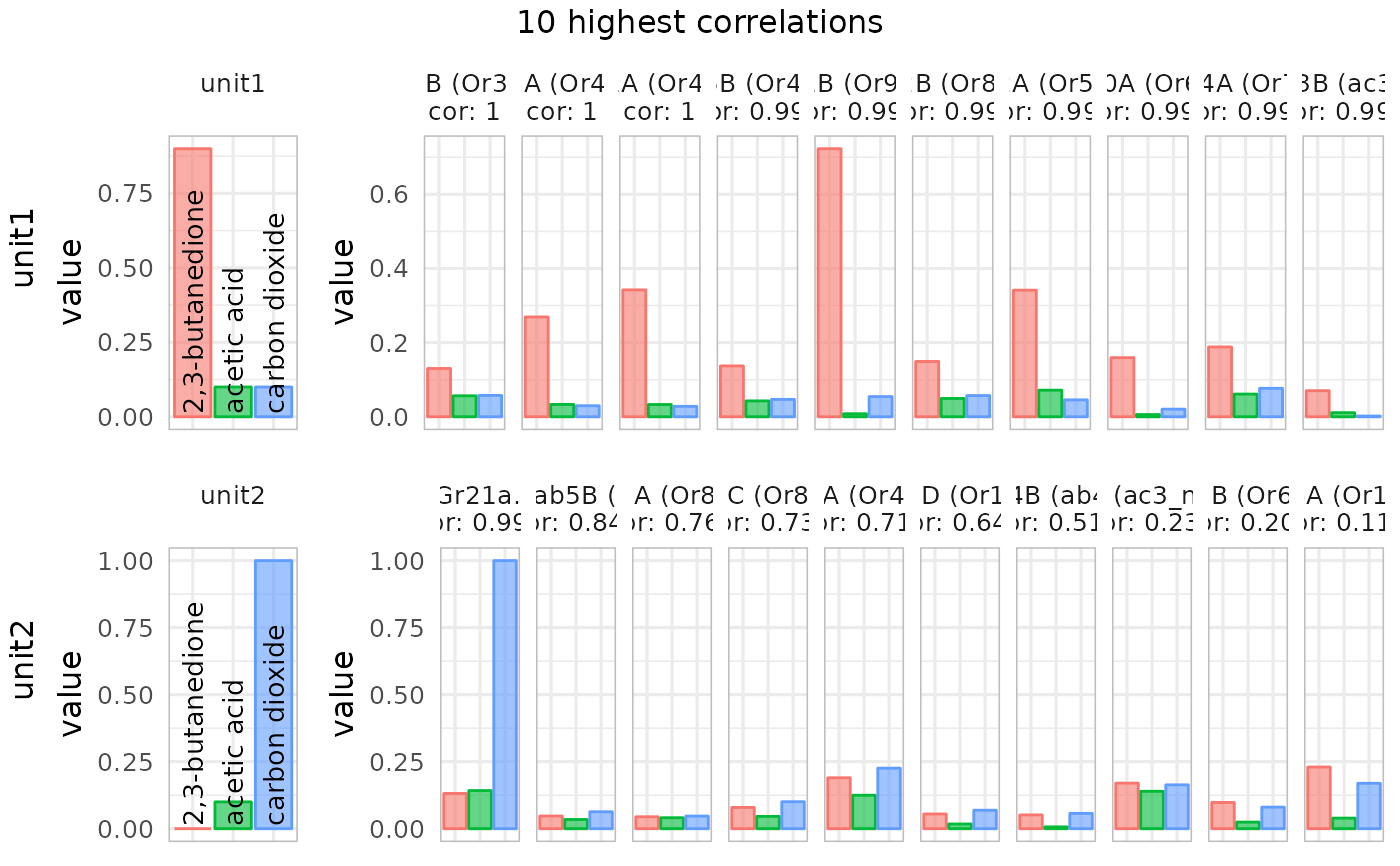
identify_sensillum(recording)
#> found correlations above 0.9 for all 2 units in: ab1
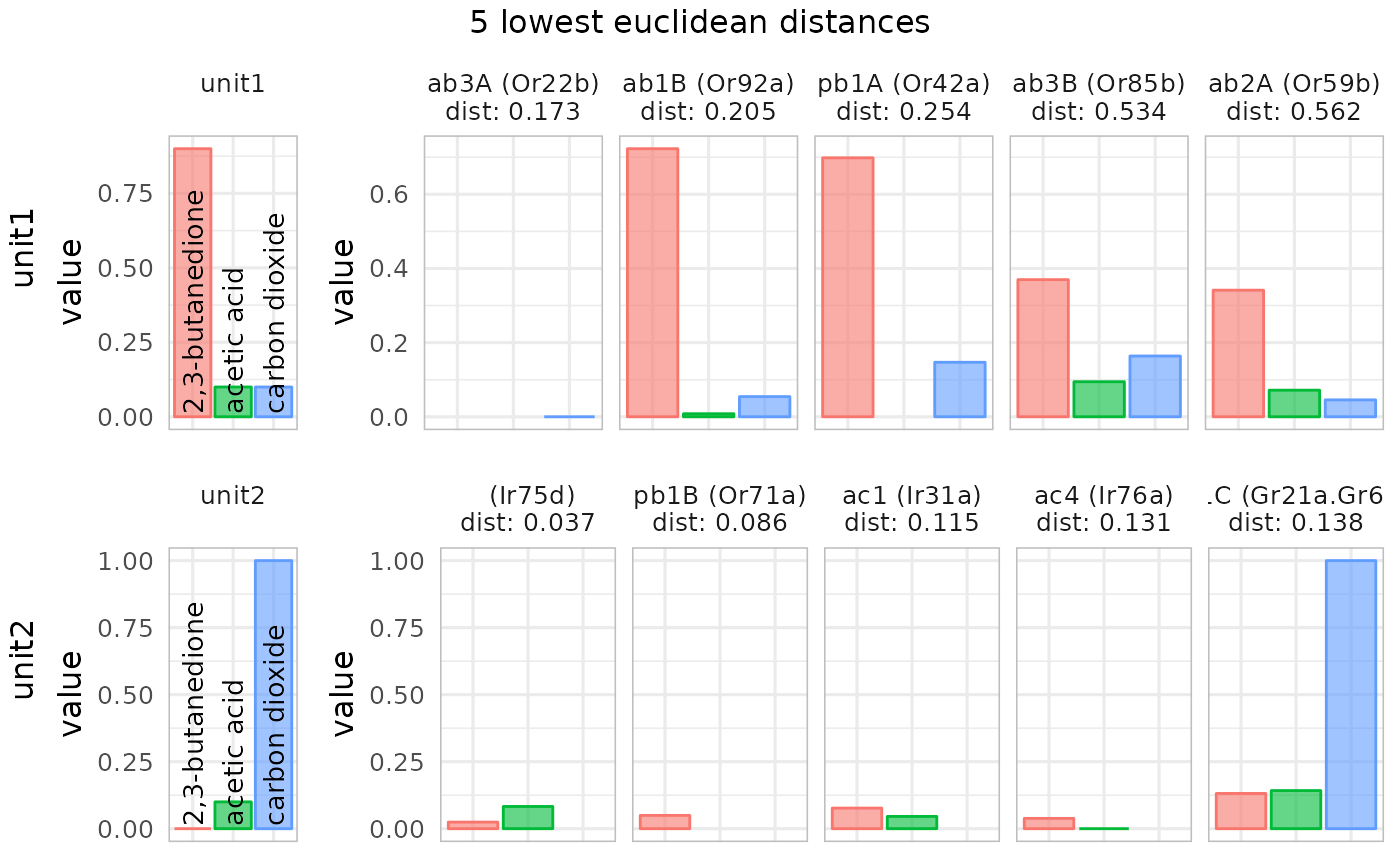
 identify_sensillum(recording, method = "dist", nshow = 5)
#> Warning: Removed 3 rows containing missing values or values outside the scale range
#> (`geom_bar()`).
#> Warning: Removed 5 rows containing missing values or values outside the scale range
#> (`geom_bar()`).
identify_sensillum(recording, method = "dist", nshow = 5)
#> Warning: Removed 3 rows containing missing values or values outside the scale range
#> (`geom_bar()`).
#> Warning: Removed 5 rows containing missing values or values outside the scale range
#> (`geom_bar()`).