Create the background for a polar plot.
Usage
get_background_grid(
  n_breaks,
  max_plot_radius,
  circle_linetype,
  dial_pos_full_x,
  dial_pos_full_y,
  time_labels,
  text_size,
  text_opacity,
  contour_labels,
  grid_angle_segments
)
Arguments
- n_breaks
The number of concentric circles that will be plotted using the
scales::breaks_pretty()function. By default, 5 breaks will be used. The number of breaks may be adjusted to result in an even interval. For example, if n_breaks is 3, but the maximum plot radius is 8, instead of plotting circles in intervals in 1.6, this interval will be rounded to 2 to result in the sequence: 0, 2, 4, 6, 8. See?scales::breaks_prettyfor more details.- max_plot_radius
The maximum radius of the background
- circle_linetype
The linetype of the concentric rings.
- dial_pos_full_x
Dimensions of the background.
- dial_pos_full_y
Dimensions of the background.
- time_labels
Labels for the tick marks (time).
- text_size
Size of label size.
- text_opacity
Opactiy of labels.
- contour_labels
Labels to use for the concentric rings (amplitude).
- grid_angle_segments
How many segments to split the plot into.
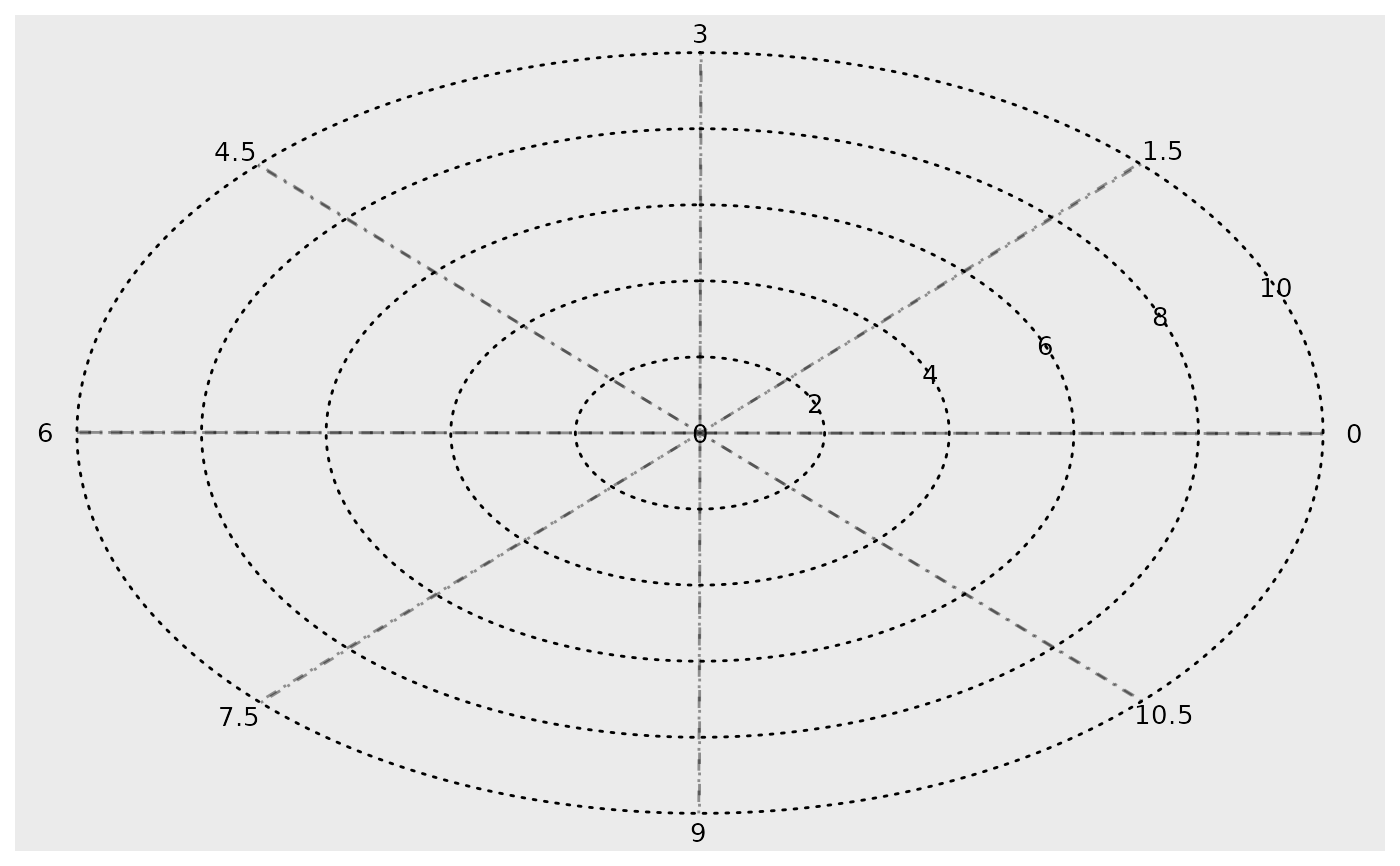
Examples
GLMMcosinor:::get_background_grid(
  n_breaks = 5,
  max_plot_radius = 10,
  circle_linetype = "dotted",
  dial_pos_full_x = c(10, 7.08, 0.008, -7.1, -10, -7.05, -0.02, 7.09, 10),
  dial_pos_full_y = c(0, 7.07, 10, 7.04, 0.016, -7.09, -10, -7.06, -0.03),
  time_labels = c(0, 1.5, 3, 4.5, 6, 7.5, 9, 10.5, 12),
  text_size = 3.5,
  text_opacity = 1,
  contour_labels = c(0, 2, 4, 6, 8, 10),
  grid_angle_segments = 8
)