summary method for the class pk.test
Usage
# S4 method for class 'pk.test'
summary(object)Value
List with the following components:
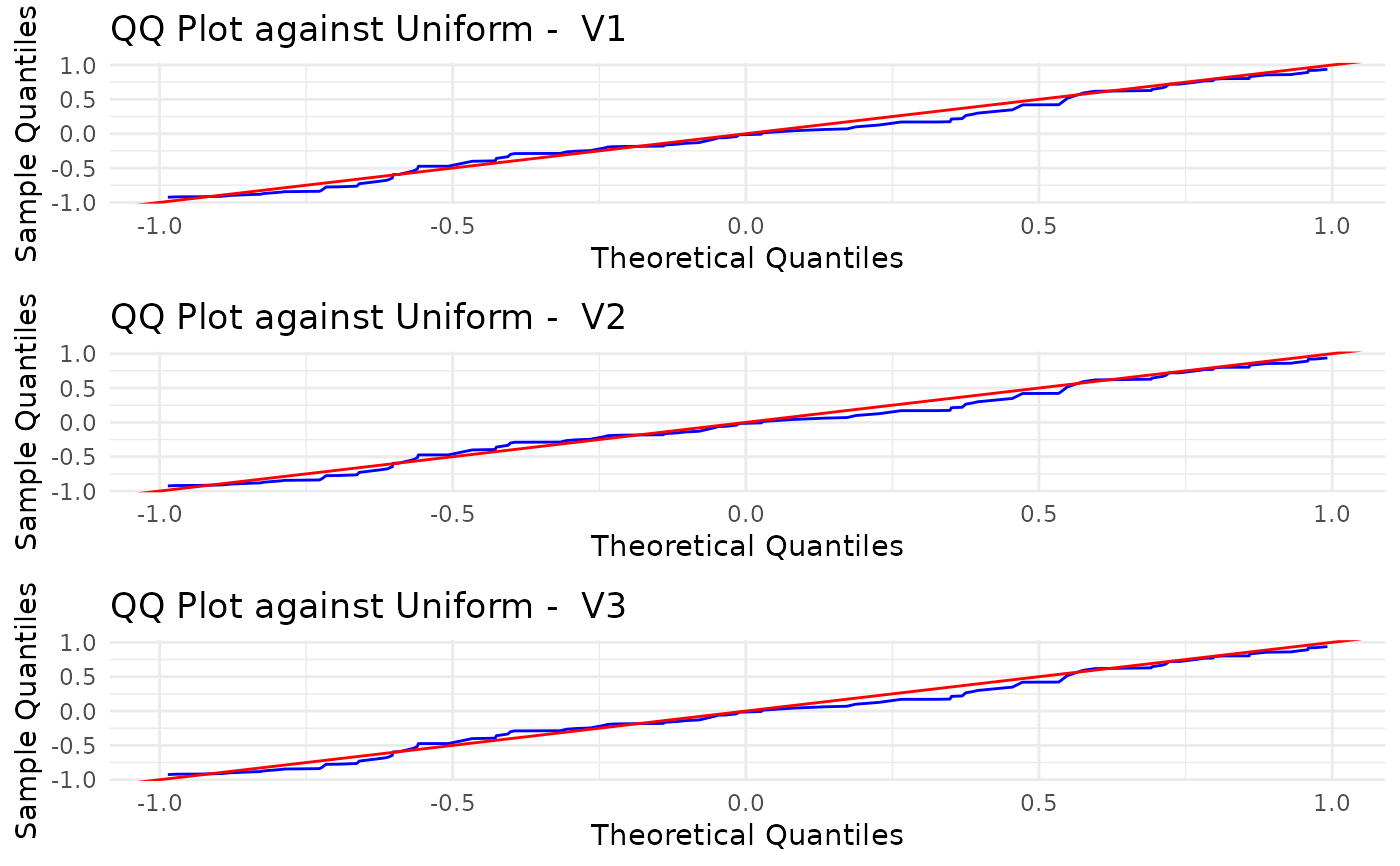
summary_tablesTable of computed descriptive statistics per variable.test_resultsData frame with the results of the performed Poisson kernel-based test.qqplotsFigure with qq-plots for each variable against the uniform distribution.
See also
pk.test() for additional details.
Examples
# create a pk.test object
x_sp <- sample_hypersphere(3, n_points=100)
unif_test <- pk.test(x_sp,rho=0.8)
summary(unif_test)
#>
#>  Poisson Kernel-based quadratic distance test of
#>                         Uniformity on the Sphere
#>   Statistic      Value Critical_Value Reject_H0
#> 1        Tn  0.2207214       1.722025     FALSE
#> 2        Sn 45.0602797      52.230766     FALSE

#> $summary_tables
#>                 V1          V2          V3
#> mean   -0.09616741  0.08709887 -0.01460631
#> sd      0.57359035  0.57642804  0.57585233
#> median -0.17876519  0.20832080 -0.04974959
#> IQR     0.95429937  0.89814932  1.00133903
#> min    -0.99451952 -0.97609712 -0.92478198
#> max     0.94196356  0.98234388  0.93822530
#>
#> $test_results
#>   Statistic      Value Critical_Value Reject_H0
#> 1        Tn  0.2207214       1.722025     FALSE
#> 2        Sn 45.0602797      52.230766     FALSE
#>
#> $qqplots

#> $summary_tables
#> V1 V2 V3
#> mean -0.09616741 0.08709887 -0.01460631
#> sd 0.57359035 0.57642804 0.57585233
#> median -0.17876519 0.20832080 -0.04974959
#> IQR 0.95429937 0.89814932 1.00133903
#> min -0.99451952 -0.97609712 -0.92478198
#> max 0.94196356 0.98234388 0.93822530
#>
#> $test_results
#> Statistic Value Critical_Value Reject_H0
#> 1 Tn 0.2207214 1.722025 FALSE
#> 2 Sn 45.0602797 52.230766 FALSE
#>
#> $qqplots
 #>
#>