Introduction
Within Europe, the Water Framework Directive (WFD) sets EU-wide standards for how the quality of surface- and ground-waters across Europe is assessed and classified. Assessment of quality using the WFD is based on a range of elements that vary depending on the type of water being assessed and are combined to give an overall classification of waterbodies into five classes (High, Good, Moderate, Poor and Bad) for surface waters and two classes (Good or Poor) for groundwaters.
In the UK the Environment Agency (EA) is the competent authority responsible for monitoring and assessment of water quality within England. The EA have made the reporting data relating to the requirements of the WFD available via the Catchment Data Explorer (CDE) website, https://environment.data.gov.uk/catchment-planning/.
cde is a package for R which facilitates searching and
download of the WFD reporting data for all waterbodies from the EA CDE
website.
The types of data that can be downloaded are: WFD status classification data, Reasons for Not Achieving Good (RNAG) status, objectives set for waterbodies and details of associated protected areas.
The CDE data are made available under the Open Government Licence v3.0 and use of the data accessed by and contained within this package implies acceptance of these licence conditions.
Installation
You can install the current development version from github with:
# if you have not done so already
# install.packages("remotes")
remotes::install_github("ropensci/cde")
Searching for sites
The search_sites function allows you to search for
waterbodies, Operational or Management Catchments or River Basin
Districts that contain a match or partial match for a specified search
string (which is case-sensitive). There is a hierarchical relationship
between waterbodies, catchments and River Basin Districts (RBD) as shown
here.
As an example, we will search for waterbodies containing the name
“Lark”.
# load the package
library(cde)

# search for waterbodies containing the name "Lark"
lark_wb<-search_names(string="Lark", column="name")
The dataframe returned contains details of all the waterbodies containing the string “Lark” in their name. The details returned include waterbody id codes (WBID), type of waterbody, Operational and Management Catchment names and River Basin District.
# show the top 6 rows of the 'name' column
head(lark_wb$name)
#> [1] "Lark (US Hawstead)"
#> [2] "Lark downstream of Mill Street Bridge"
#> [3] "Lark (Hawstead to Abbey Gardens)"
#> [4] "Lark (Abbey Gardens to Mildenhall)"
#> [5] "Lark"
#> [6] "Lark - Fynn (d/s confluence)"
To search for Operational Catchments containing the same string we would use the following code.
lark_oc<-search_names(string="Lark", column="OC")Retrieving quality status classification data
Having located a waterbody, catchment or River Basin District that we
want to retrieve data for, we can use the get_status
function to retrieve the status classification information from the CDE
website. We can extract the data for a specific year, or a range of
years. For Operational/Management Catchment or River Basin District
level downloads, we can also extract information just for a specific
waterbody type (such as rivers) or for all waterbody types. In addition
it is possible to extract classification data relating to a specific
element of the classification.
The overall classification is made up of a number of different
elements in a hierarchy. Details of the hierarchy of classification
levels can be found here.
By default it retrieves the “Overall Water Body”” classification status,
but by specifying the level, information on a specific
level of classification can be retrieved. The possible values are:
| Level 1 | Level 2 | Level 4 |
|---|---|---|
| Ecological | Biological quality elements | Overall Water Body |
| Chemical | Chemical Status element | - |
| Quantitative | Hydromorphological Supporting Elements | - |
| - | Other Substances | - |
| - | Physico-chemical quality elements | - |
| - | Priority hazardous substances | - |
| - | Priority substances | - |
| - | Quantitative Status element | - |
| - | Specific pollutants | - |
| - | Supporting elements | - |
The function returns an object of class cde_df
(basically a dataframe with custom print and plot methods) containing
the status (and other details) for the specified combination of column,
value, level and dates. Note that during 2013 and 2014 waterbodies were
classified under both Cycle 1 and Cycle 2 methodologies. The status
information extracted for these years is just for the Cycle 2
classification, to avoid double counting. There was also a change in
some of the environmental standards applied to chemical aspects of
status assessment between cycles, so there may be some noticeable
changes in status between these years. See here
for more details.
For details of the meaning of the the different columns returned, see the output reference list.
# extract overall waterbody status classification data for a single
# waterbody in all years

# first decide which waterbody, we can use one from the first search
# above (need the WBID information)
head(lark_wb)
#>                WBID                                  name  type    OC
#> 1911 GB105033042920                    Lark (US Hawstead) River  Lark
#> 1912 GB105033043052 Lark downstream of Mill Street Bridge River  Lark
#> 1914 GB105033042940      Lark (Hawstead to Abbey Gardens) River  Lark
#> 1918 GB105033043051    Lark (Abbey Gardens to Mildenhall) River  Lark
#> 2197 GB105035040360                                  Lark River Deben
#> 2200 GB105035040300          Lark - Fynn (d/s confluence) River Deben
#>                    MC     RBD
#> 1911 Cam and Ely Ouse Anglian
#> 1912 Cam and Ely Ouse Anglian
#> 1914 Cam and Ely Ouse Anglian
#> 1918 Cam and Ely Ouse Anglian
#> 2197     East Suffolk Anglian
#> 2200     East Suffolk Anglian

# we will get data for the first waterbody here (WBID: GB105033042920,
# name: Lark (US Hawstead))
lark_hawstead<-get_status(ea_name="GB105033042920", column="WBID")

# the dataframe returned contains all of the data for this site in all
# years (we did not specify year/year range).
lark_hawstead
#>  river_basin_district management_catchment operational_catchment
#>               Anglian     Cam and Ely Ouse                  Lark
#>               Anglian     Cam and Ely Ouse                  Lark
#>               Anglian     Cam and Ely Ouse                  Lark
#>               Anglian     Cam and Ely Ouse                  Lark
#>               Anglian     Cam and Ely Ouse                  Lark
#>               Anglian     Cam and Ely Ouse                  Lark
#>               Anglian     Cam and Ely Ouse                  Lark
#>               Anglian     Cam and Ely Ouse                  Lark
#>               Anglian     Cam and Ely Ouse                  Lark
#>               Anglian     Cam and Ely Ouse                  Lark
#> With an additional 17 columns of data.
#> Row values may be truncated to fit console.

# just a quick look at the actual status data
table(lark_hawstead$status)
#>
#>     Good Moderate
#>        1        9
An example of a higher level download, specifying a year range and type (in this case Rivers).
# download status data for a given year range and type of waterbody
lark_OC_rivers<-get_status(ea_name="Lark", column="OC", startyr=2013, endyr=2015, type="River")
# print out the results
lark_OC_rivers
#>  river_basin_district management_catchment operational_catchment
#>               Anglian     Cam and Ely Ouse                  Lark
#>               Anglian     Cam and Ely Ouse                  Lark
#>               Anglian     Cam and Ely Ouse                  Lark
#>               Anglian     Cam and Ely Ouse                  Lark
#>               Anglian     Cam and Ely Ouse                  Lark
#>               Anglian     Cam and Ely Ouse                  Lark
#>               Anglian     Cam and Ely Ouse                  Lark
#>               Anglian     Cam and Ely Ouse                  Lark
#>               Anglian     Cam and Ely Ouse                  Lark
#>               Anglian     Cam and Ely Ouse                  Lark
#> With an additional 26 rows and 17 columns of data.
#> Row values may be truncated to fit console.
To get information about status classification in relation to a
specific level in the classification, we can specify level
as well (see table above for options and here
for more details on the classification levels used).
# download Chemical status for rivers in all years
lark_OC_rivers_chem<-get_status(ea_name="Lark", column="OC", type="River", level="Chemical")
Plotting quality status classification data
The get_status function, along with other
get_... functions, has a plot method which
provides quick overview plots of status classes, giving a plot of
percentages of waterbodies in different status classes for the
combination of criteria specified. Plotting is only possible for
Operational/Management Catchment or River Basin District downloads.
# get overall waterbody status information for the Lark OC between 2013 and 2015
lark_OC_2013_15 <- get_status(ea_name="Lark", column="OC", startyr=2013, endyr=2015)
# plot the data
plot(lark_OC_2013_15)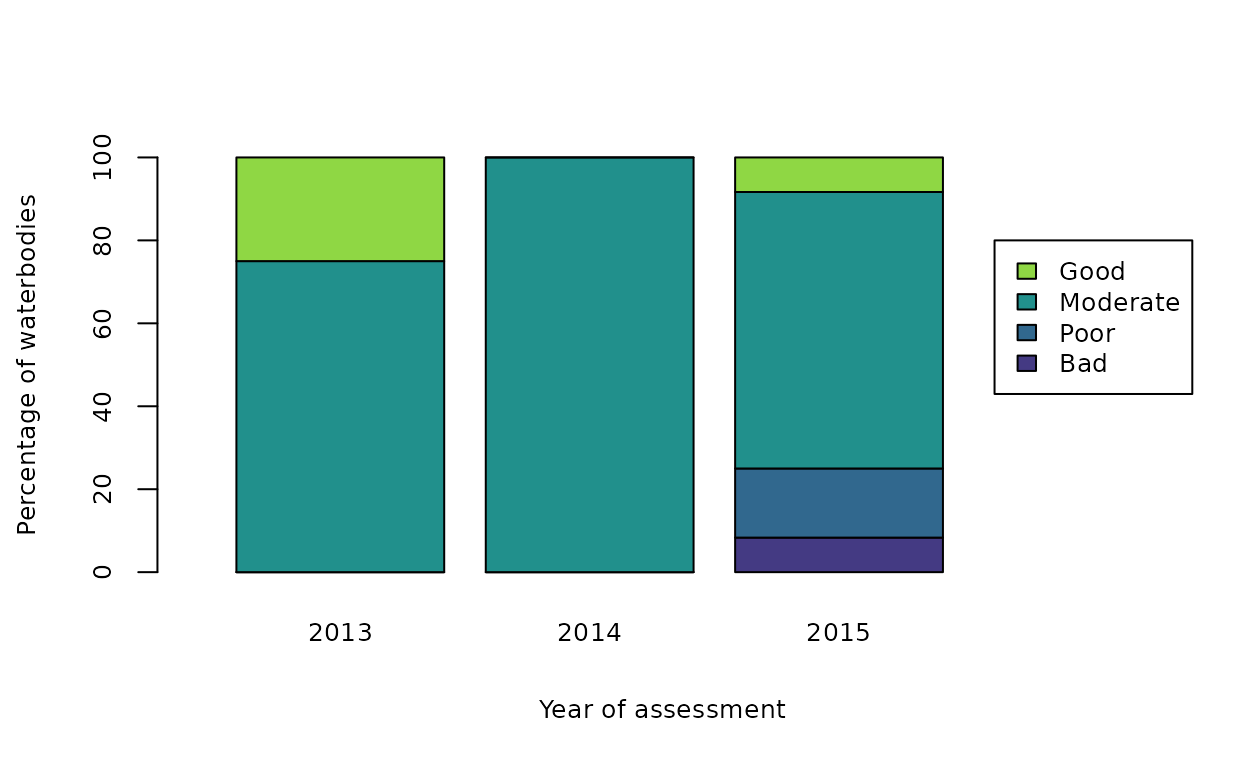
For plots, the colour scheme used is based on the
viridis palette. For get_status and
get_objectives an alternative colour scheme, based on the
WFD-defined status class colours, can be used instead by setting
scheme="wfd" within a plot call. Also if a
single year is specified, a standard (as opposed to stacked) barplot is
produced as shown below.
# get the overall waterbody status information for rivers in the Lark OC in 2015
lark_OC_rivers_2015 <- get_status(ea_name="Lark", column="OC", startyr=2015, type="River")
# plot these data, using WFD colour scheme
plot(lark_OC_rivers_2015, scheme="wfd")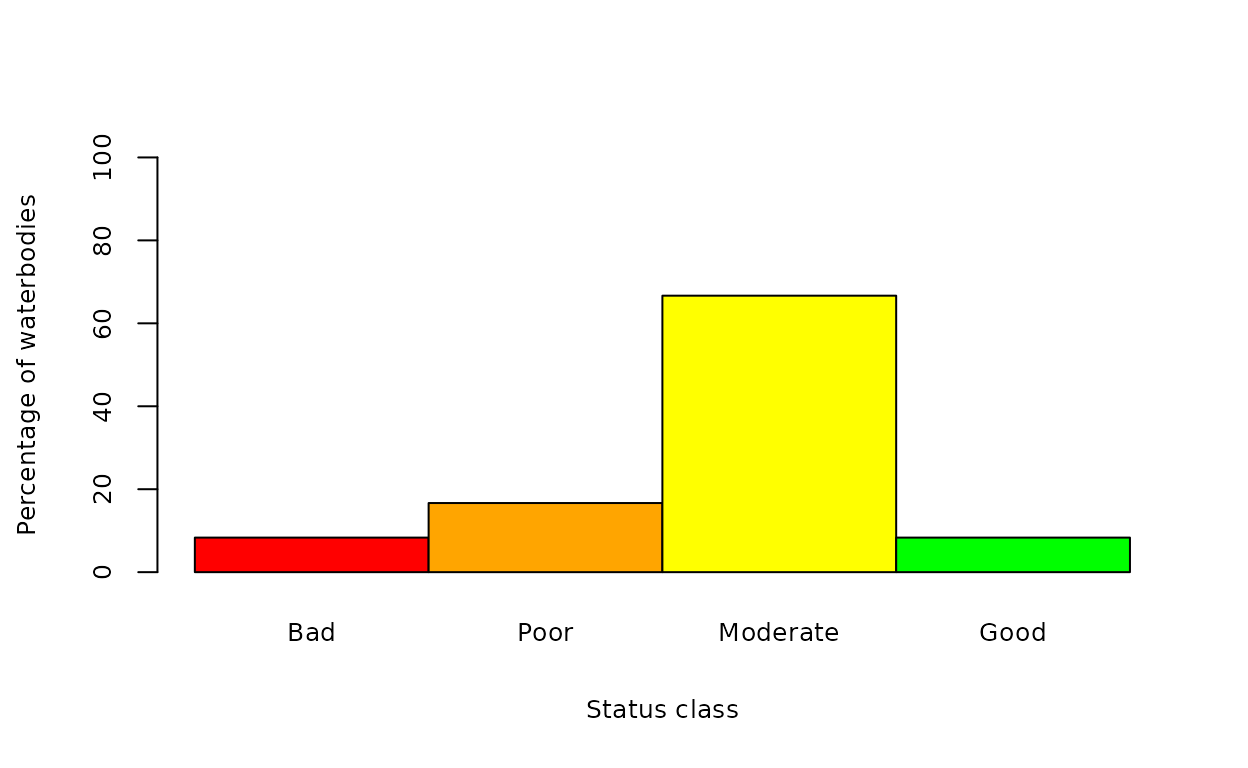
Reasons for Not Achieving Good status
Not all waterbodies in the Lark Operational Catchment example above
have achieved Good status. The get_rnag function downloads
Reasons for Not Achieving Good (RNAG) data, which allow us to find out
more detail on the pressures on the waterbodies that have been assessed
to be driving the failure. The RNAG data can be extracted for specific
classification levels, as per the status data above.
For details of the meaning of the the different columns returned, see the output reference list.
# what are the RNAG for the Lark OC
lark_OC_RNAG <- get_rnag(ea_name="Lark", column="OC")
Plots of RNAG data are given as frequency histograms of the occurence
of information in the pressure_tier_3 column. For details
of this, see the reference list.
# plot RNAG data for the Lark OC
plot(lark_OC_RNAG)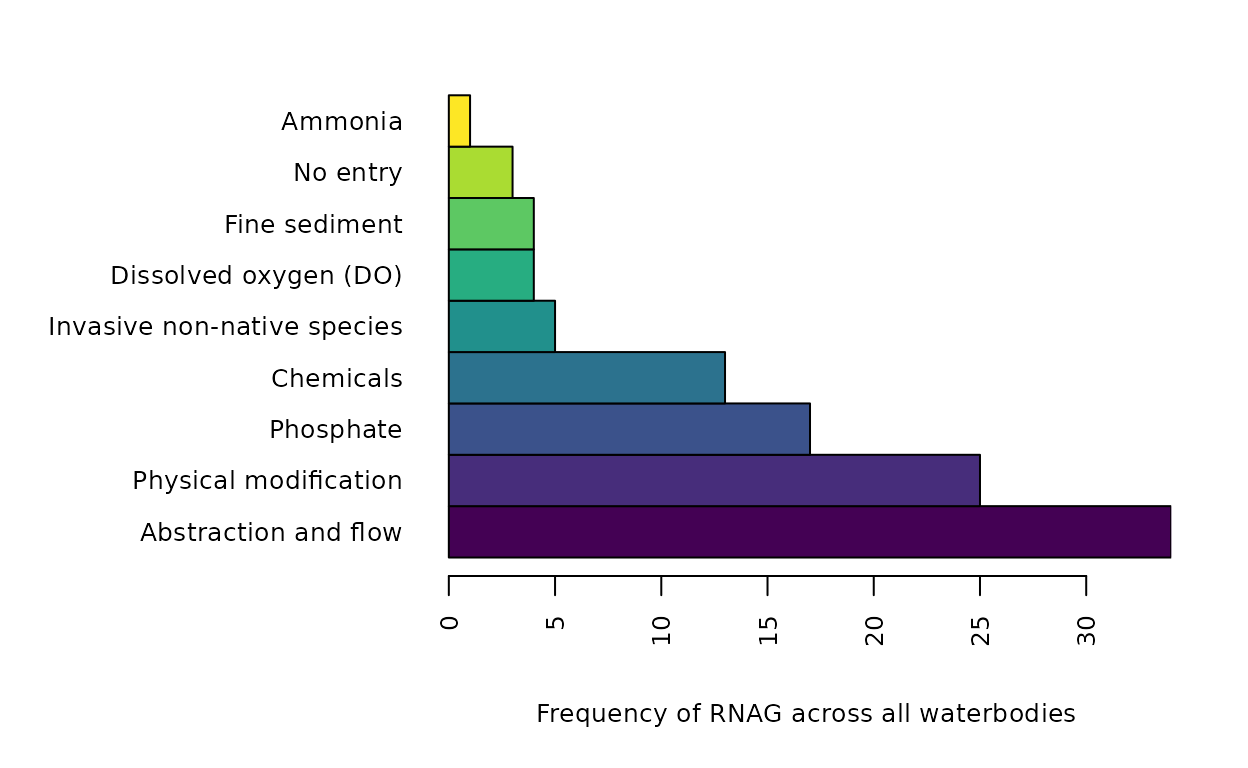
Objectives set for waterbodies
For those waterbodies that are at less than Good status, objectives
are set to indicate what status is aimed for in the longer term. The
objectives are set in relation to what is determined to be achievable in
the given timescale. Therefore objectives have been set in relation to
the 6-year cycle of assessment (so years 2015, 2021 and 2027, then also
2040 and 2050 for long-term objectives). Using the
get_objectives function, we can download objectives for
waterbodies, catchments or River Basin Districts. Objectives can be
downloaded for a specific year (2015, 2021, 2027, 2040 or 2050), level
of classification and waterbody type as per the get_status
function. Note however that not all waterbodies have objectives set for
all years, levels or types. If no objectives are set for the criteria
specified, a message is given.
For details of the meaning of the the different columns returned, see the output reference list.
# download the objectives set for 2015 for the Lark Operational Catchment
lark_OC_obj_2015<-get_objectives(ea_name="Lark", column="OC", year=2015)
Plotting of objectives is similar to that of get_status
data, except the status classes represent the target objectives
predicted to be achieved by the date specified.
# plot the objectives for the Lark OC in 2015
plot(lark_OC_obj_2015)
Protected Areas
The get_pa function downloads details of the protected
areas associated with a waterbody, catchment or River Basin District.
The protected areas listed include those designated under conservation
reasons, such as SACs (Habitats and Species Directive), pollution
reduction, such as Nitrate Vulnerable Zones (Nitrates Directive) or
human use (Bathing Water Directive).
For details of the meaning of the the different columns returned, see the output reference list.
# get details of the protected areas within the Lark Operational Catchment
lark_OC_pa<-get_pa(ea_name="Lark", column="OC")
Plotting the output of get_pa produces a frequency
histogram of the protected_area_type column within the area
specified.
plot(lark_OC_pa)