Produces the traceplots and the density plots of the model parameters. Can
also be used to plot the time-varying and time-invariant parameters of the
model along with their posterior intervals. See the plot_type argument
for details on available plots.
Arguments
- x
[
dynamitefit]
The model fit object.- plot_type
[
character(1)]
What type of plot to draw? The default is"default"which draws posterior means and intervals of the parameters selected bytypesorparameters. If both"types"andparametersareNULL, all parameters are drawn up to the maximum specified byn_params. Option"trace"instead draws posterior densities and traceplots of the parameters. Option"dag"instead plots the directed acyclic graph of the model formula, seeplot.dynamiteformula()for the arguments available for this option.- types
[
character(1)]
Types of the parameter for which the plots should be drawn. Possible options can be found with the functionget_parameter_types(). Ignored if the argumentparametersis supplied.- parameters
[
charecter()]
Parameter name(s) for which the plots should be drawn. Possible options can be found with the functionget_parameter_names(). The default is all parameters, limited byn_params.- responses
[
character()]
Response(s) for which the plots should be drawn. Possible options areunique(x$priors$response). Default is all responses. Ignored if the argumentparametersis supplied.- groups
[
character(1)]
Group name(s) for which the plots should be drawn for group-specific parameters.- times
[
double()]
Time point(s) for which the plots should be drawn for time-varying parameters. By default, all time points are included, up to the maximum number of parameters specified byn_paramsstarting from the first non-fixed time point.- level
[
numeric(1)]
Level for posterior intervals. Default is 0.05, leading to 90% intervals.- alpha
[
numeric(1)]
Opacity level forgeom_ribbon. Default is 0.5.- facet
[
logical(1)]
Should the time-invariant parameters be plotted separately (TRUE) or in a single plot (FALSE)?- scales
[
character(1)]
Should y-axis of the panels be"fixed"(the default) or"free"? Seeggplot2::facet_wrap().- n_params
[
integer()]
A single value or a vector of length 2 specifying the maximum number of parameters to plot. If a single value is provided, the same limit is used for all parameters. If a vector is supplied, the first element defines the maximum number of time-invariant parameters to plot and the second the maximum number of time-varying parameters to plot. The defaults values are 20 for time-invariant parameters and 3 for time-varying parameters. The default value is 5 forplot_type == "trace".- ...
Arguments passed to
plot.dynamiteformula()when usingplot_type = "dag".
See also
Drawing plots
plot.dynamiteformula()
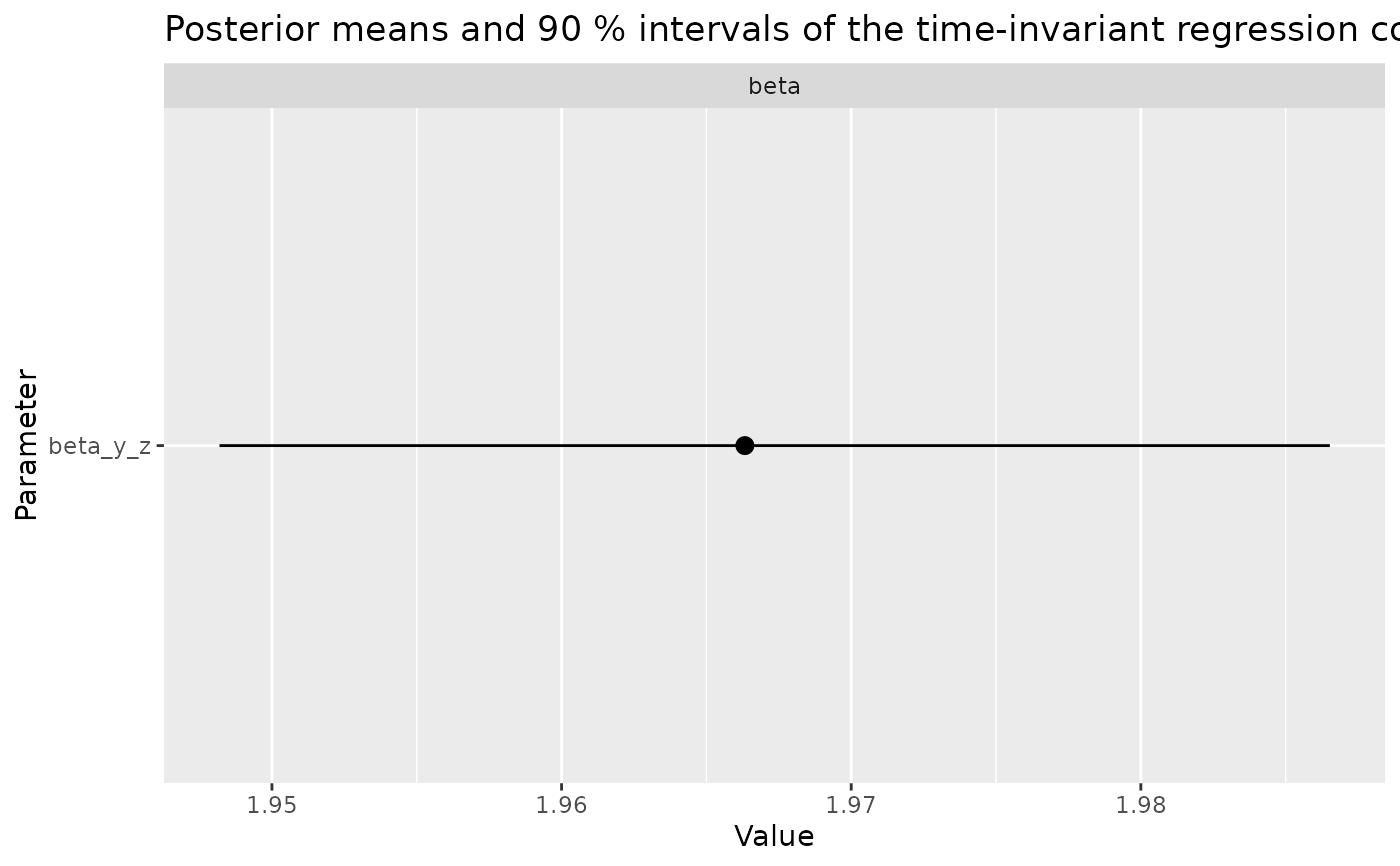
Examples
data.table::setDTthreads(1) # For CRAN
plot(gaussian_example_fit, type = "beta")