This function plots the result of sw_combine() and the
interval for, or the exact felling date of, a group of tree-ring series,
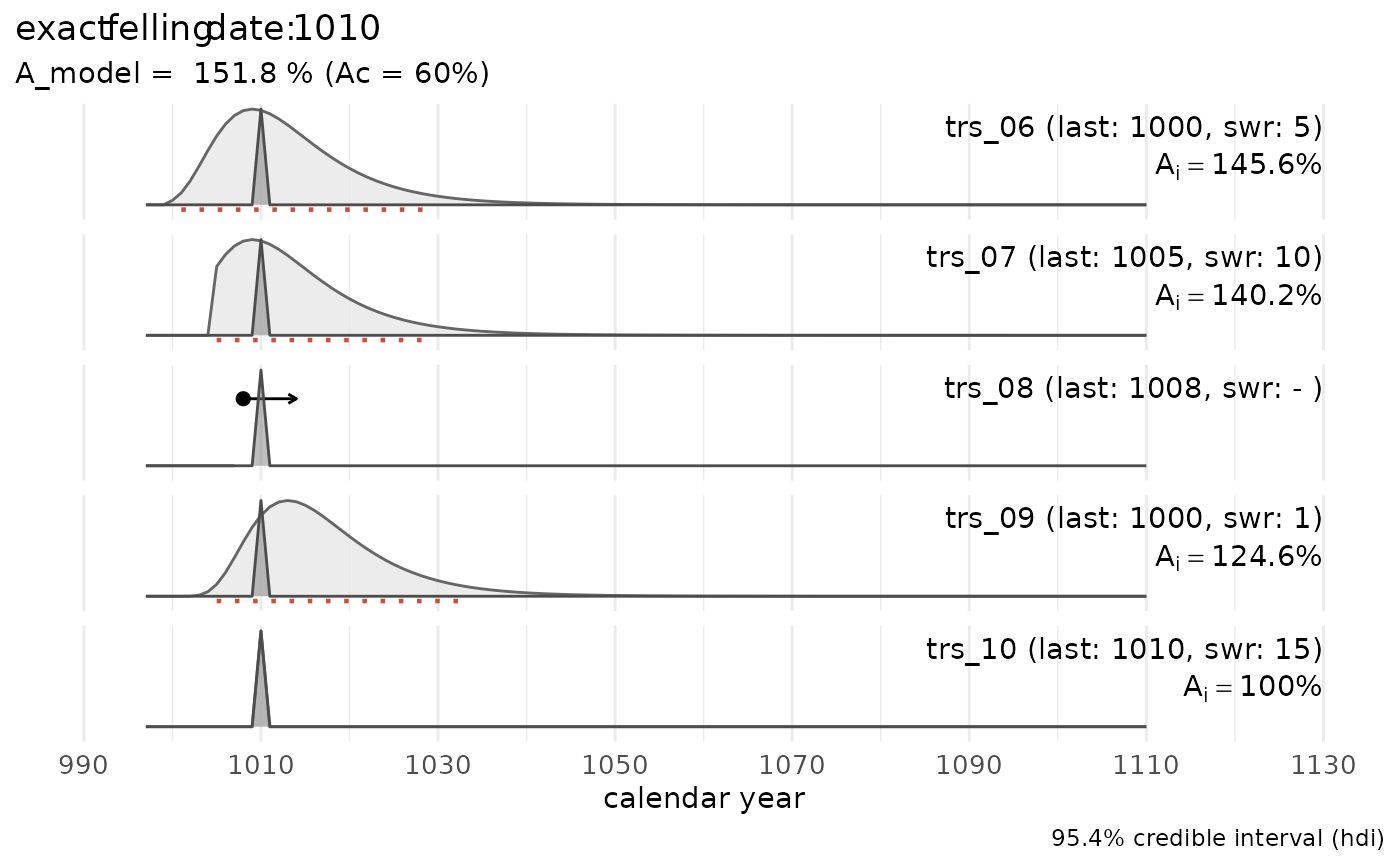
with agreement indices for the global model.
Arguments
- x
Output of
sw_combine().
Value
A ggplot-style graph, with calendar years on the X-axis and the probability (p) on the Y-axis. Dots represent exact felling dates.
Examples
sw_example2
#>   series last n_sapwood waneyedge
#> 1 trs_06 1000         5     FALSE
#> 2 trs_07 1005        10     FALSE
#> 3 trs_08 1008        NA     FALSE
#> 4 trs_09 1000         1     FALSE
#> 5 trs_10 1010        15      TRUE
tmp <- sw_combine(sw_example2)
sw_combine_plot(tmp)