Creates a line plot of all tree-ring series in an rwl dataframe, with optional z-score standardization and faceting options.
Arguments
- x
A
data.frame(typically of class'rwl') with multiple columns of ring-width values. Row names must be numeric and represent calendar years.- zscore
Logical. If
TRUE, the ring-width series are standardized to z-scores before plotting. Defaults toTRUE.- facet
Logical. If
TRUE, creates a faceted plot with each series in a separate panel. IfFALSE, plots all series overlaid on the same plot. Defaults toFALSE.- ncol
Numeric. Number of columns for faceted plots (only used when
facet = TRUE). Defaults to1.- color
Character string or vector specifying line color(s). When
NULLandfacet = FALSE, each series gets a different color. When a single color is specified, all lines use that color. When a vector of colors is provided, each series gets the corresponding color. Defaults toNULL.- scale_y
Character string specifying y-axis scaling for faceted plots. Options are "fixed", "free", "free_x", or "free_y". Defaults to
"fixed".
Details
The function assumes that the rwl dataframe is already calendar-dated with years as row names.
When facet = FALSE, all series are plotted on the same axes with different colors.
When facet = TRUE, each series gets its own panel for easier individual inspection.
When providing a vector of colors, the length must match the number of series in the data.
Required helper functions include: trs_trim and trs_zscore.
Required packages: ggplot2, plyr, tidyr, dplyr
Examples
rwl_data <- trs_pseudo_rwl(n_series = 5, series_length = c(75, 100), end_date = c(2000, 2025))
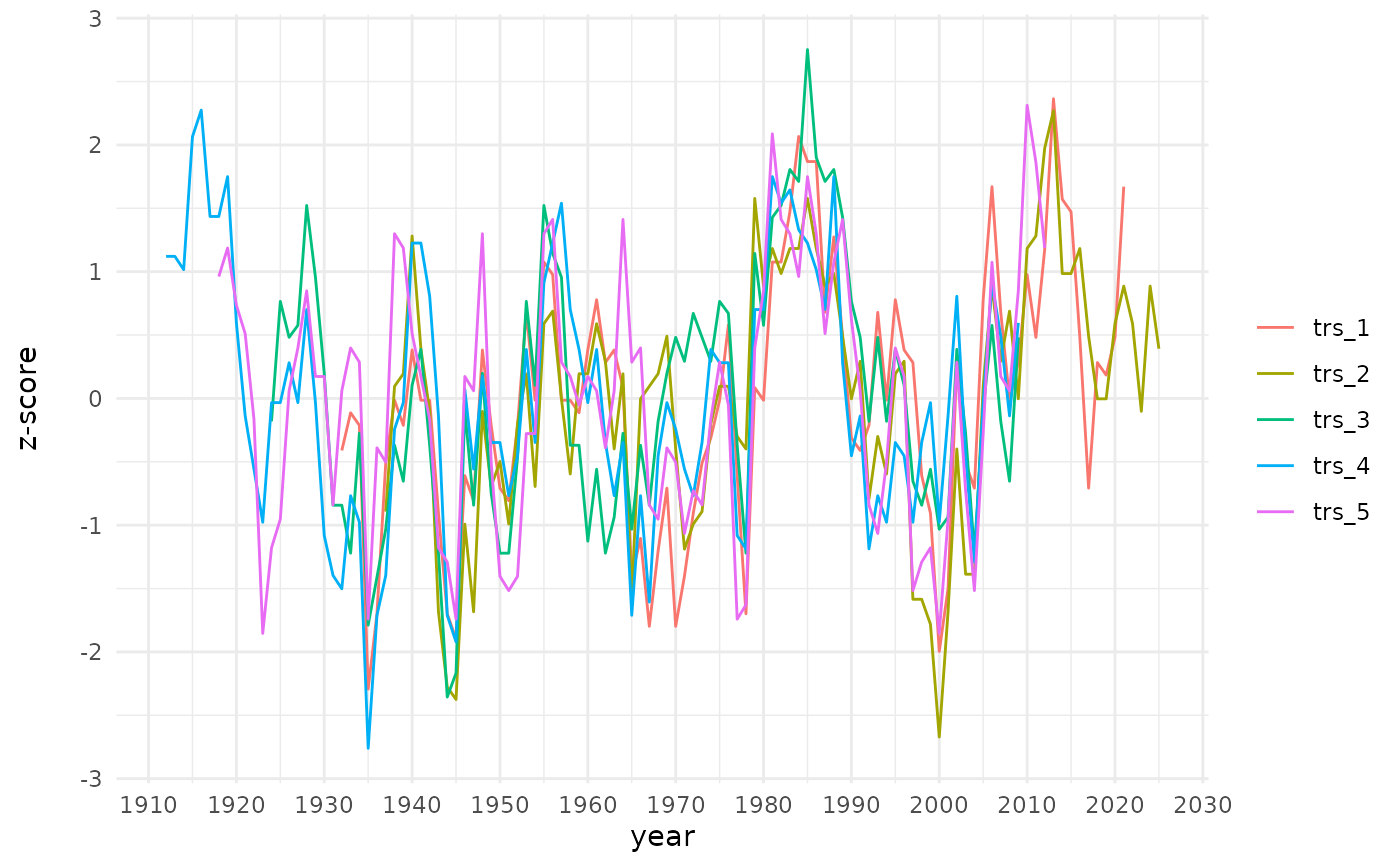
# Overlaid plot with z-scores
trs_plot_rwl(rwl_data, zscore = TRUE, facet = FALSE)
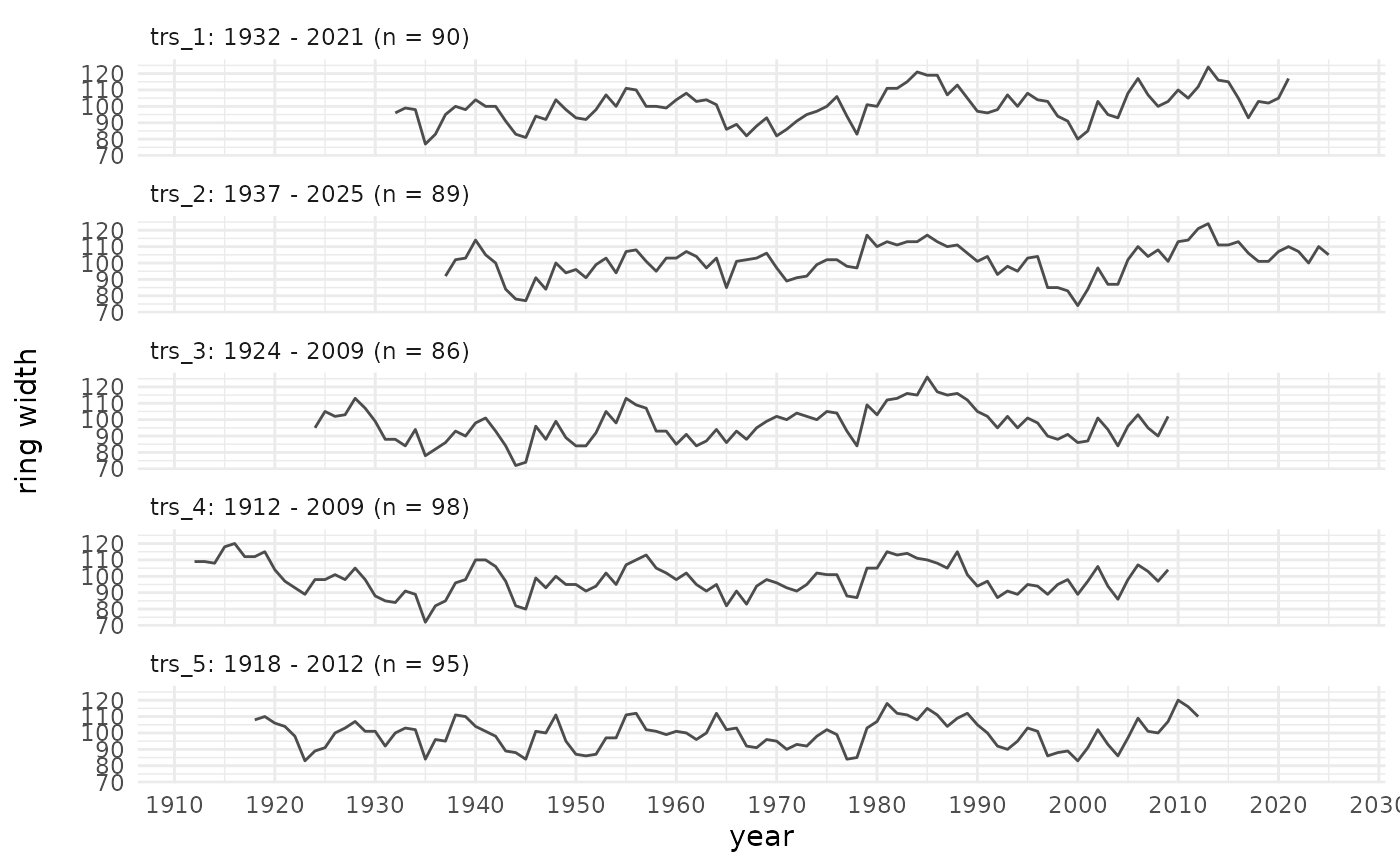
 # Faceted plot with raw values
trs_plot_rwl(rwl_data, zscore = FALSE, facet = TRUE, ncol = 1)
#> Ignoring unknown labels:
#> • colour : ""
# Faceted plot with raw values
trs_plot_rwl(rwl_data, zscore = FALSE, facet = TRUE, ncol = 1)
#> Ignoring unknown labels:
#> • colour : ""
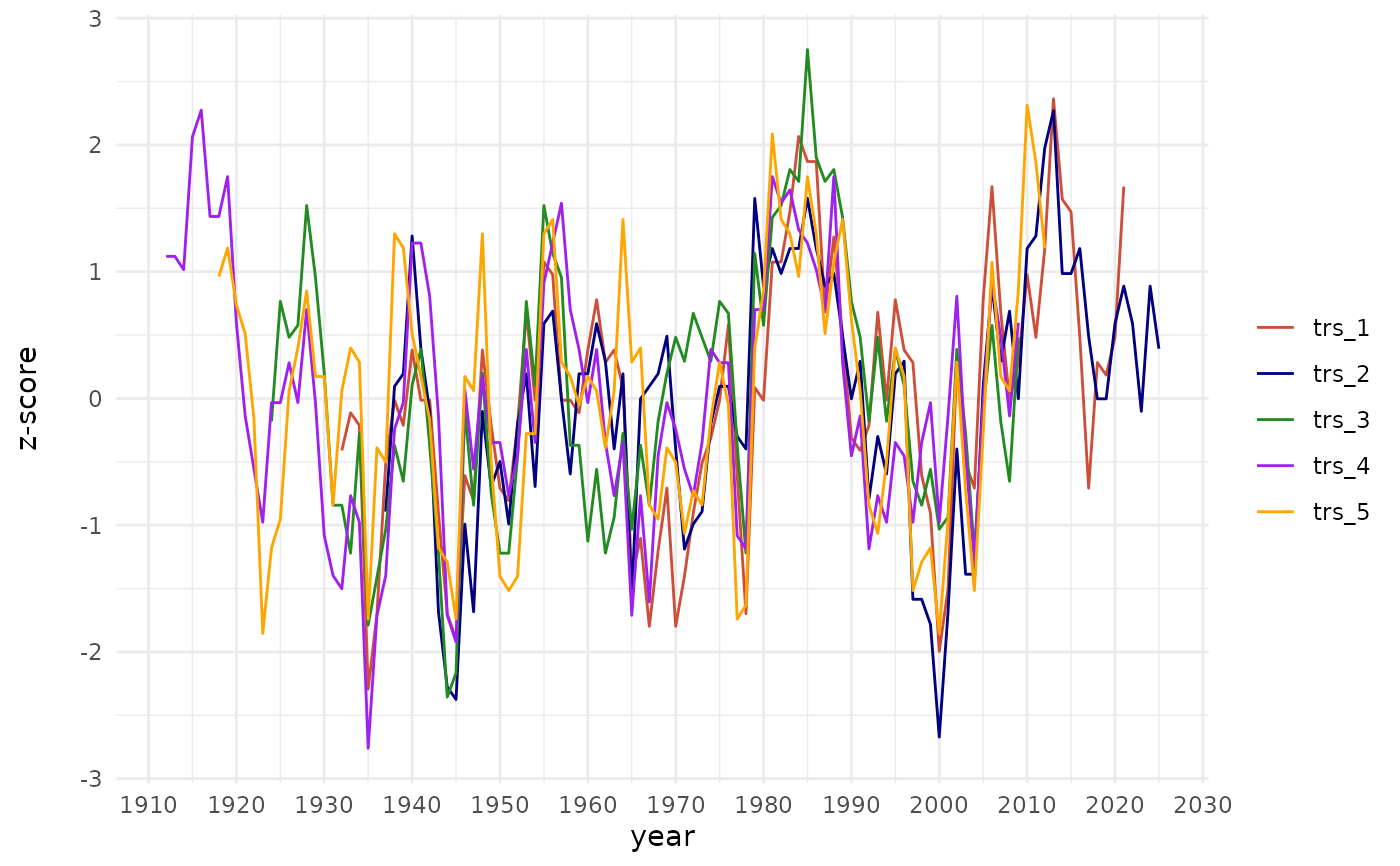
 # Custom colors for each series
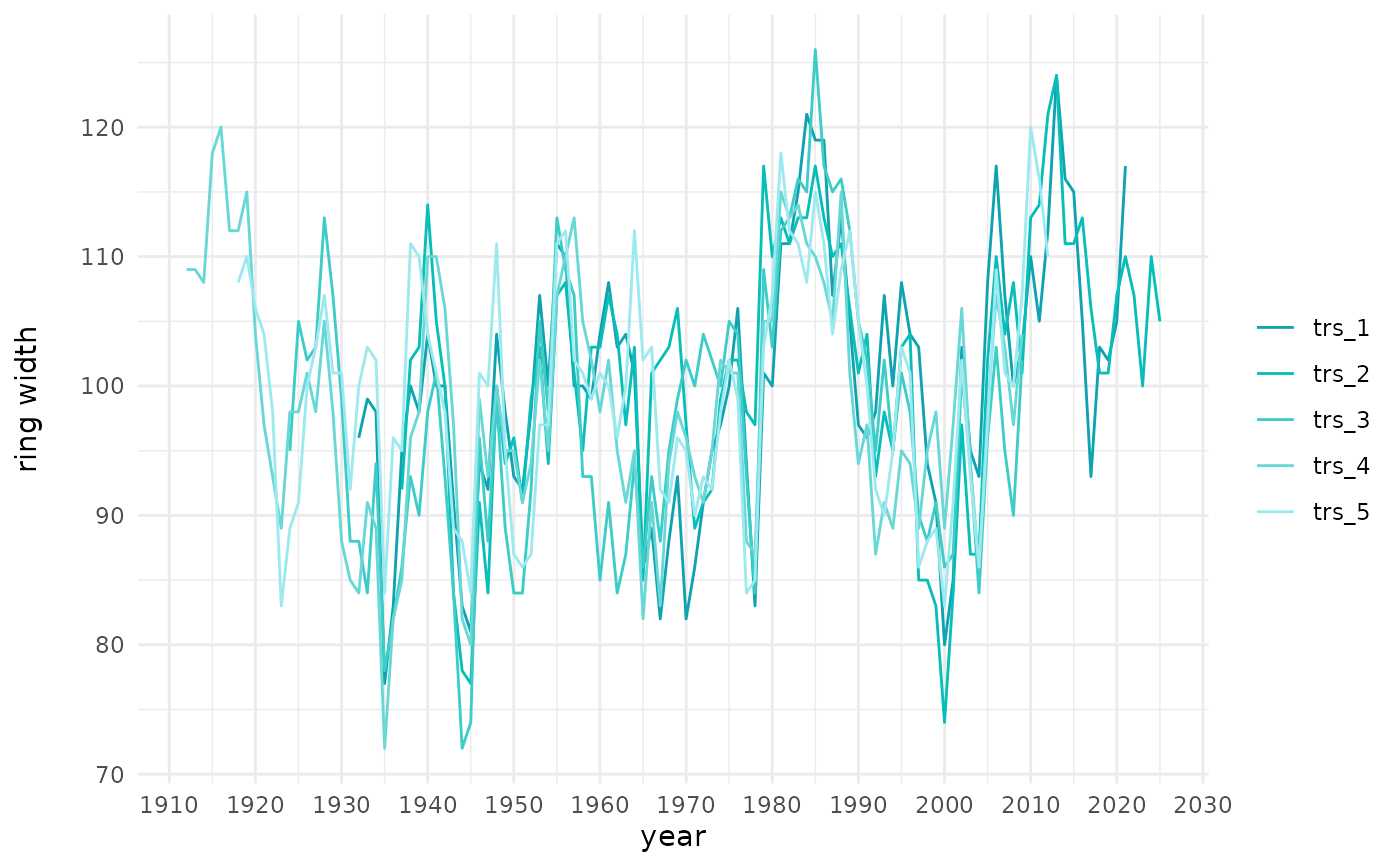
col_vec <- c("#0fa3b1", "#07beb8", "#3dccc7", "#68d8d6", "#9ceaef")
trs_plot_rwl(rwl_data, color = c("tomato3", "navyblue", "forestgreen", "purple", "orange"))
# Custom colors for each series
col_vec <- c("#0fa3b1", "#07beb8", "#3dccc7", "#68d8d6", "#9ceaef")
trs_plot_rwl(rwl_data, color = c("tomato3", "navyblue", "forestgreen", "purple", "orange"))
 trs_plot_rwl(rwl_data, color = col_vec, zscore = FALSE)