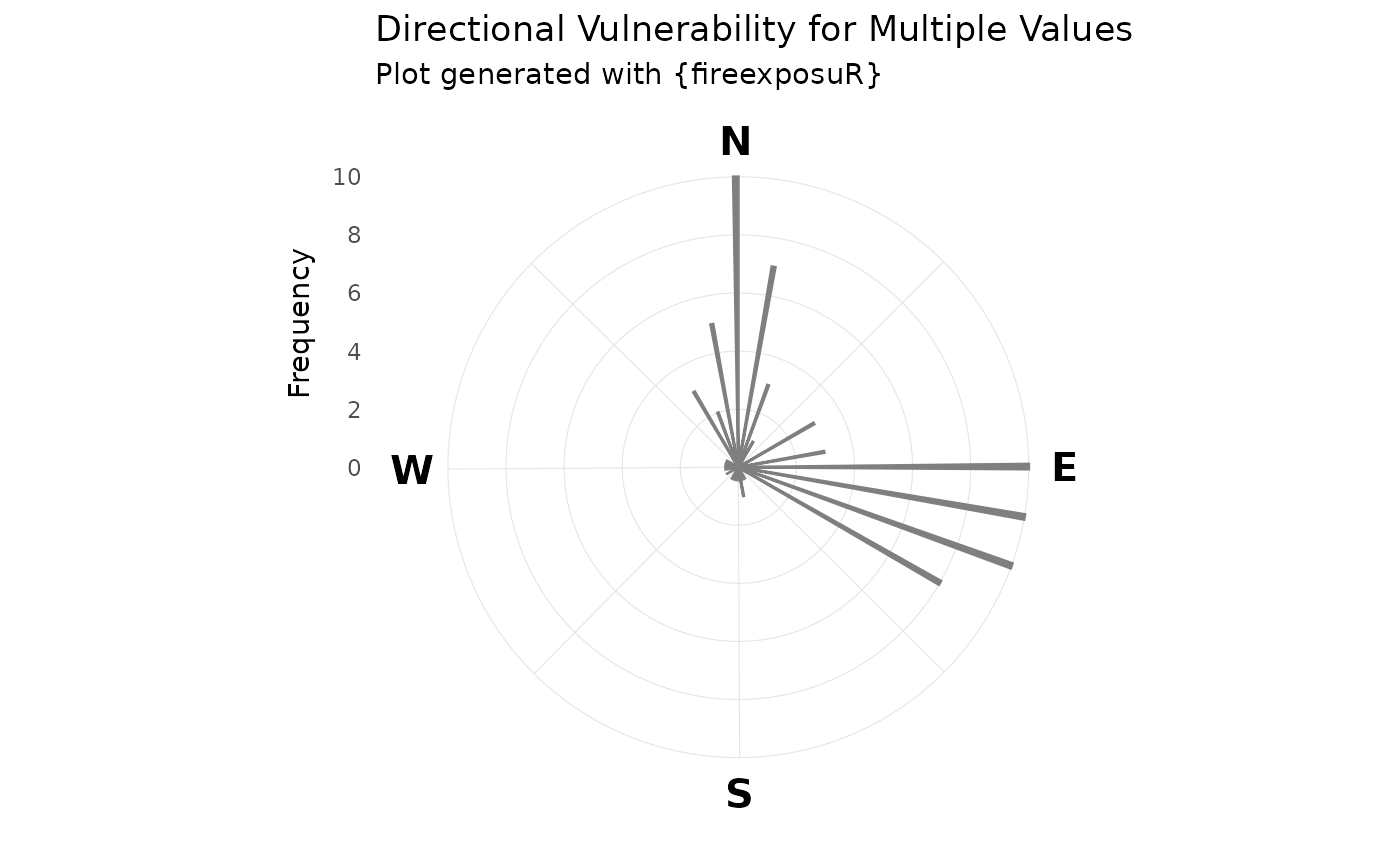
Plot directional load for multiple values
Source:R/fire_exp_dir_multi_plot.R
fire_exp_dir_multi_plot.Rdfire_exp_dir_multi_plot() plots the results from
fire_exp_multi()
Arguments
- dir_multi
data.frame from
fire_exp_dir_multi()- full
Boolean. Ignored when
plot = FALSE. WhenTRUE: all 3 transect segments must be viable. whenFALSE: only the segments from seg2 and seg3 are considered (Default)- title
(Optional) String. A custom title for the plot. The default is
"Directional Vulnerability for Multiple Values"
Details
The plot is based on the methods presented in Beverly and Forbes 2023. For each degree, the frequency of input values with a continuous pathway at that trajectory is found. This summary can be useful in identifying trends in directional exposure to values within a regional area of interest.
Continuous pathways can be shown for the full span of all three
directional assessment transect segments, or limited to the outer two
segments with the full parameter. If the values being assessed are variable
sizes and being represented as points, it is recommended this parameter
remains set to FALSE. The inner segment is sensitive to the size of the
value when a point is used.
References
Beverly JL, Forbes AM (2023) Assessing directional vulnerability to wildfire. Natural Hazards 117, 831-849. doi:10.1007/s11069-023-05885-3
Examples
# read example hazard data
hazard_file_path <- "extdata/hazard.tif"
hazard <- terra::rast(system.file(hazard_file_path, package = "fireexposuR"))

# generate 10 random example points within the hazard extent
e <- terra::buffer(terra::vect(terra::ext(hazard), crs = hazard), -15500)
points <- terra::spatSample(e, 10)

# compute exposure metric
exposure <- fire_exp(hazard)

# plot directional load for multiple points
dir_multi <- fire_exp_dir_multi(exposure, points, interval = 10)

fire_exp_dir_multi_plot(dir_multi)