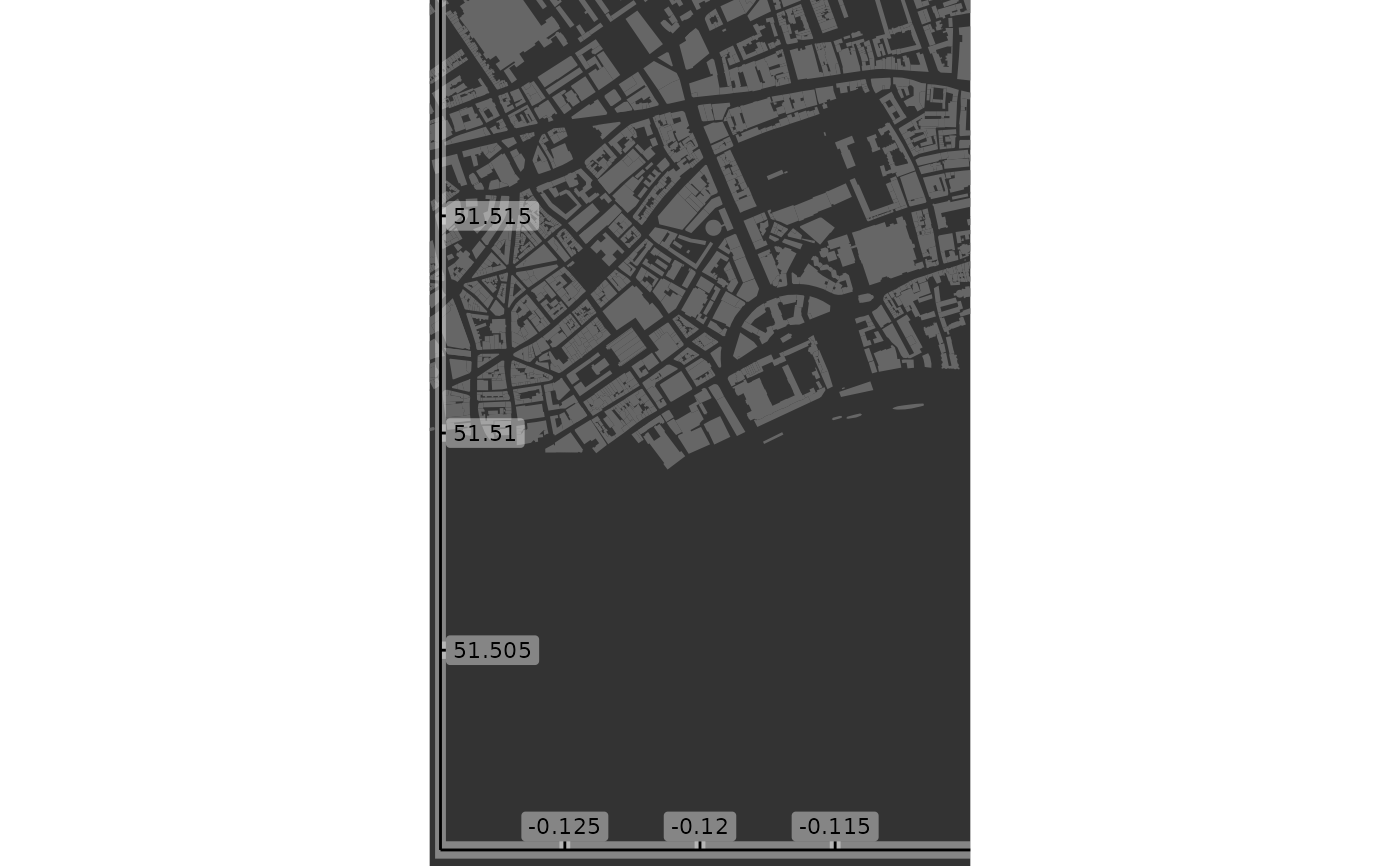
Adds axes to the internal region of an OSM plot.
Usage
add_axes(
  map,
  colour = "black",
  pos = c(0.02, 0.03),
  alpha = 0.4,
  fontsize = 3,
  fontface,
  fontfamily,
  ...
)
Arguments
- map
A
ggplot2object to which the axes are to be added.- colour
Colour of axis (determines colour of all elements: lines, ticks, and labels).
- pos
Positions of axes and labels relative to entire plot device.
- alpha
alpha value for semi-transparent background surrounding axes and labels (lower values increase transparency).
- fontsize
Size of axis font (in
ggplot2terms; default=3).- fontface
Fontface for axis labels (1:4=plain,bold,italic,bold-italic).
- fontfamily
Family of axis font (for example, `
Times').- ...
Mechanism to allow many parameters to be passed with alternative names (
colorforcolourandxyzforfontxyz.
See also
Other map-extra:
add_colourbar(),
osm_line2poly()
Examples
bbox <- get_bbox (c (-0.13, 51.5, -0.11, 51.52))
map <- osm_basemap (bbox = bbox, bg = "gray20")
map <- add_osm_objects (map, london$dat_BNR, col = "gray40")
map <- add_axes (map)
print (map)


# Map items are added sequentially, so adding axes prior to objects will
# produce a different result.
map <- osm_basemap (bbox = bbox, bg = "gray20")
map <- add_axes (map)
map <- add_osm_objects (map, london$dat_BNR, col = "gray40")
print_osm_map (map)
# Map items are added sequentially, so adding axes prior to objects will
# produce a different result.
map <- osm_basemap (bbox = bbox, bg = "gray20")
map <- add_axes (map)
map <- add_osm_objects (map, london$dat_BNR, col = "gray40")
print_osm_map (map)