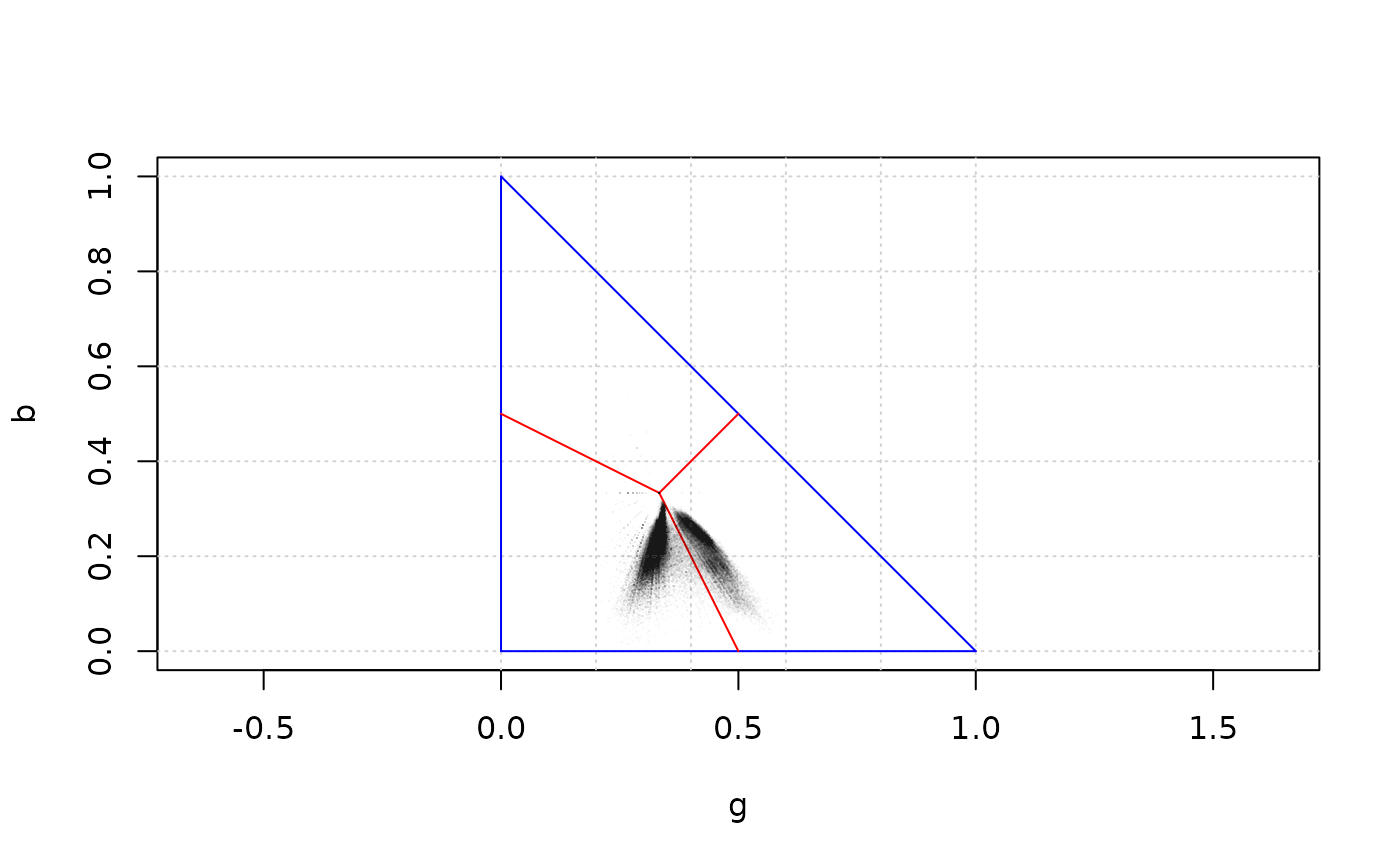
This function is a wrapper for function points() in package
graphics for plotting the pixels of a transformed rgb image on the
triangular diagram previously created by plot_rgb_plane().
Arguments
- image_rgb
an object produced by
read_image().- x_axis
a character string indicating which colour variable use as x.
- y_axis
a character string indicating which colour variable use as y.
- ...
additional graphical parameters, mainly to set the colour (
col) of the points.
Details
It is advantageous to specify a colour such as "#00000005"
which is black but almost transparent. In this way a kind of density plot
is created because the clustering of points creates areas of darker colour.
Note that a colour without specific transparency information defaults to an
opaque colour, so "#000000" is the same as "#000000ff". The
colours can be specified in any form understandable by
grDevices::col2rgb, but the hexadecimal string allows setting the
colour transparency and it is the preferred style. Note also that the
points are plotted using pch = ".", as any other symbol would clutter the
graph.
Warning: plotting several million points in an R graph is a slow process. Be patient or reduce the size of the images as much as possible. Having a nice smartphone with a petapixel camera sensor is good for artistic purposes, but not always for efficient scientific work.
Examples
# Plotting the pixels of the example image included in this package
ivy_oak_rgb <- read_image(system.file("extdata", "IvyOak400x300.JPG",
                                       package = "pixelclasser"))
plot_rgb_plane("g", "b")
plot_pixels(ivy_oak_rgb, "g", "b", col = "#00000005")