Create plots of from predictNMB simulations.
Usage
# S3 method for class 'predictNMBsim'
autoplot(
  object,
  what = c("nmb", "inb", "cutpoints", "qalys", "costs"),
  inb_ref_col = NA,
  conf.level = 0.95,
  methods_order = NULL,
  n_bins = 40,
  label_wrap_width = 12,
  fill_cols = c("grey50", "#ADD8E6"),
  median_line_size = 2,
  median_line_alpha = 0.5,
  median_line_col = "black",
  rename_vector,
  ...
)
Arguments
- object
A
predictNMBsimobject.- what
What to summarise: one of "nmb", "inb", "cutpoints", "qalys" or "costs". Defaults to "nmb".
- inb_ref_col
Which cutpoint method to use as the reference strategy when calculating the incremental net monetary benefit. See
do_nmb_simfor more information.- conf.level
The confidence level of the interval. Defaults to 0.95 (coloured area of distribution represents 95% CIs).
- methods_order
The order (left to right) to display the cutpoint methods.
- n_bins
The number of bins used when constructing histograms. Defaults to 40.
- label_wrap_width
The number of characters in facet labels at which the label is wrapped. Default is 12.
- fill_cols
Vector containing the colours used for fill aesthetic of histograms. The first colour represents the area outside of the confidence region, second colour shows the confidence region. Defaults to
c("grey50", "#ADD8E6").- median_line_size
Size of line used to represent the median of distribution. Defaults to 2.
- median_line_alpha
Alpha (transparency) for line used to represent the median of distribution. Defaults to 0.5.
- median_line_col
Colour of line used to represent the median of distribution. Defaults to
"black".- rename_vector
A named vector for renaming the methods in the summary. The values of the vector are the default names and the names given are the desired names in the output.
- ...
Additional (unused) arguments.
Details
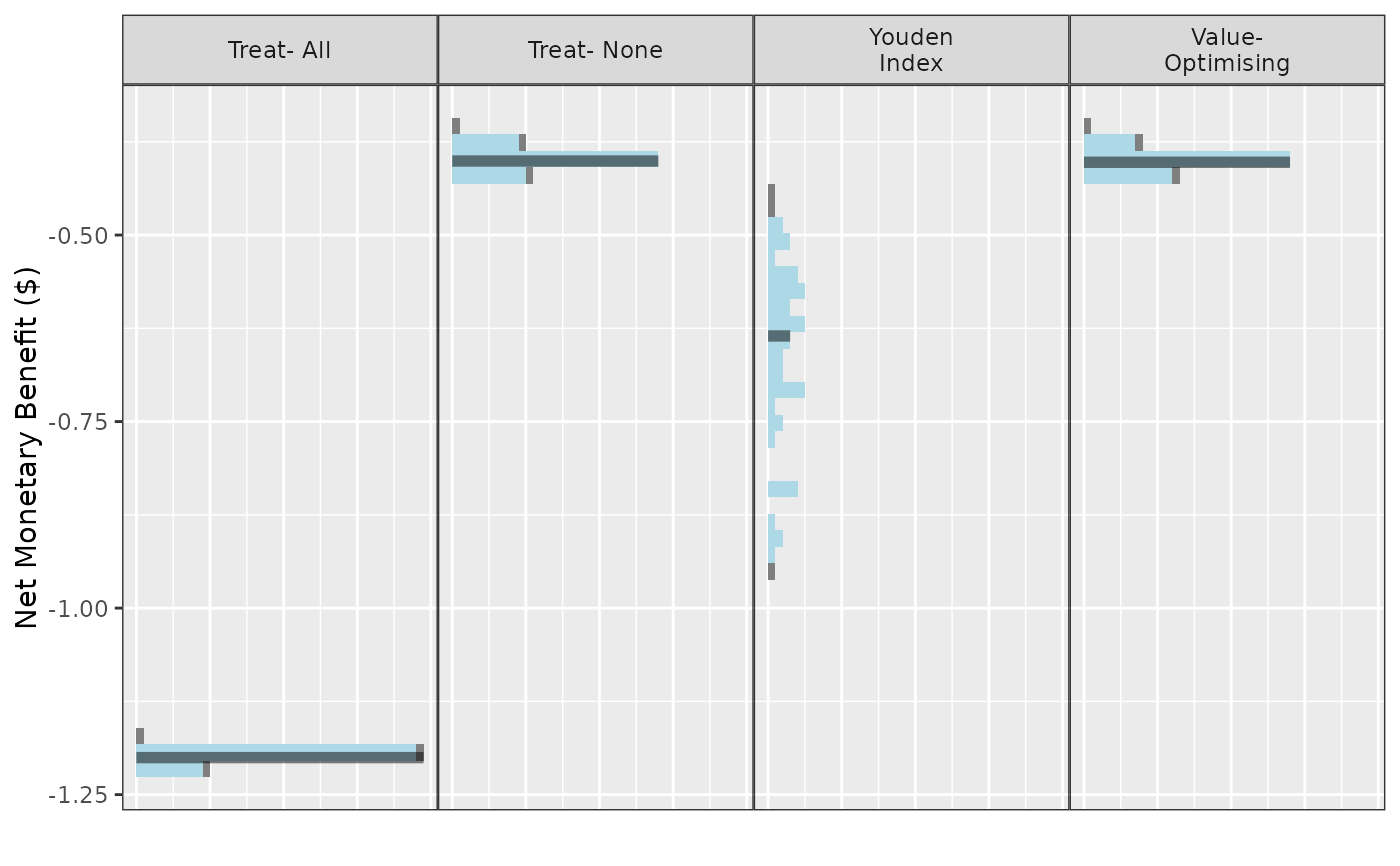
This plot method works with predictNMBsim objects that are created
using do_nmb_sim(). Can be used to visualise distributions from
simulations for different cutpoint methods.
Examples
# \donttest{
get_nmb <- function() c("TP" = -3, "TN" = 0, "FP" = -1, "FN" = -4)
sim_obj <- do_nmb_sim(
  sample_size = 200, n_sims = 50, n_valid = 10000, sim_auc = 0.7,
  event_rate = 0.1, fx_nmb_training = get_nmb, fx_nmb_evaluation = get_nmb,
  cutpoint_methods = c("all", "none", "youden", "value_optimising")
)

autoplot(
  sim_obj,
  rename_vector = c(
    "Value- Optimising" = "value_optimising",
    "Treat- None" = "none",
    "Treat- All" = "all",
    "Youden Index" = "youden"
  )
) + theme_sim()

# }
# }