Forecasting temperature at your vacation destination
M. Salmon
Source:vignettes/articles/forecast.Rmd
forecast.RmdFor Christmas I’ll travel to Marseille. What temperatures should I
expect there? I could of course open a weather app, but in this vignette
I want to give an example using the riem and
forecast packages.
Find airport for Marseille
The name of the network for France is “FR__ASOS”. I already know there’s only one airport near the city.
library("riem")
library("dplyr")
france_airports <- riem_stations(network = "FR__ASOS")
marseilles_airport <- filter(france_airports, grepl("MARSEILLE", name) | grepl("Marseille", name))
marseilles_airport
## # A tibble: 1 × 22
## index id synop name country elevation network online plot_name archive_end
## <int> <chr> <dbl> <chr> <chr> <dbl> <chr> <lgl> <chr> <chr>
## 1 71 LFML 99999 Mars… FR 36 FR__AS… TRUE MARSEILL… NA
## # ℹ 12 more variables: modified <chr>, spri <int>, tzname <chr>, iemid <int>,
## # archive_begin <chr>, metasite <lgl>, wigos <chr>, longitude <dbl>,
## # latitude <dbl>, state <chr>, lon <dbl>, lat <dbl>Get time series of temperature for Marseille airport
We’ll transform it to daily average, and convert Fahrenheit to
Celsius thanks to the weathermetrics package. We impute the
missing values and remove outliers via the use of
forecast::tsclean.
marseille <- riem_measures(
  station = marseilles_airport$id,
  date_start = "2010 01 01"
)

marseille <- group_by(marseille, day = as.Date(valid))
marseille <- summarize(marseille, temperature = mean(tmpf))
marseille <- mutate(marseille, temperature = weathermetrics::fahrenheit.to.celsius(temperature))
library("ggplot2")


library("forecast")
marseille_ts <- ts(as.vector(tsclean(marseille$temperature)), freq = 365.25, start = c(2010, 1))
autoplot(marseille_ts) +
  ylab("Daily average temperature in Marseille airport (ºC)") +
  xlab("Time (days)")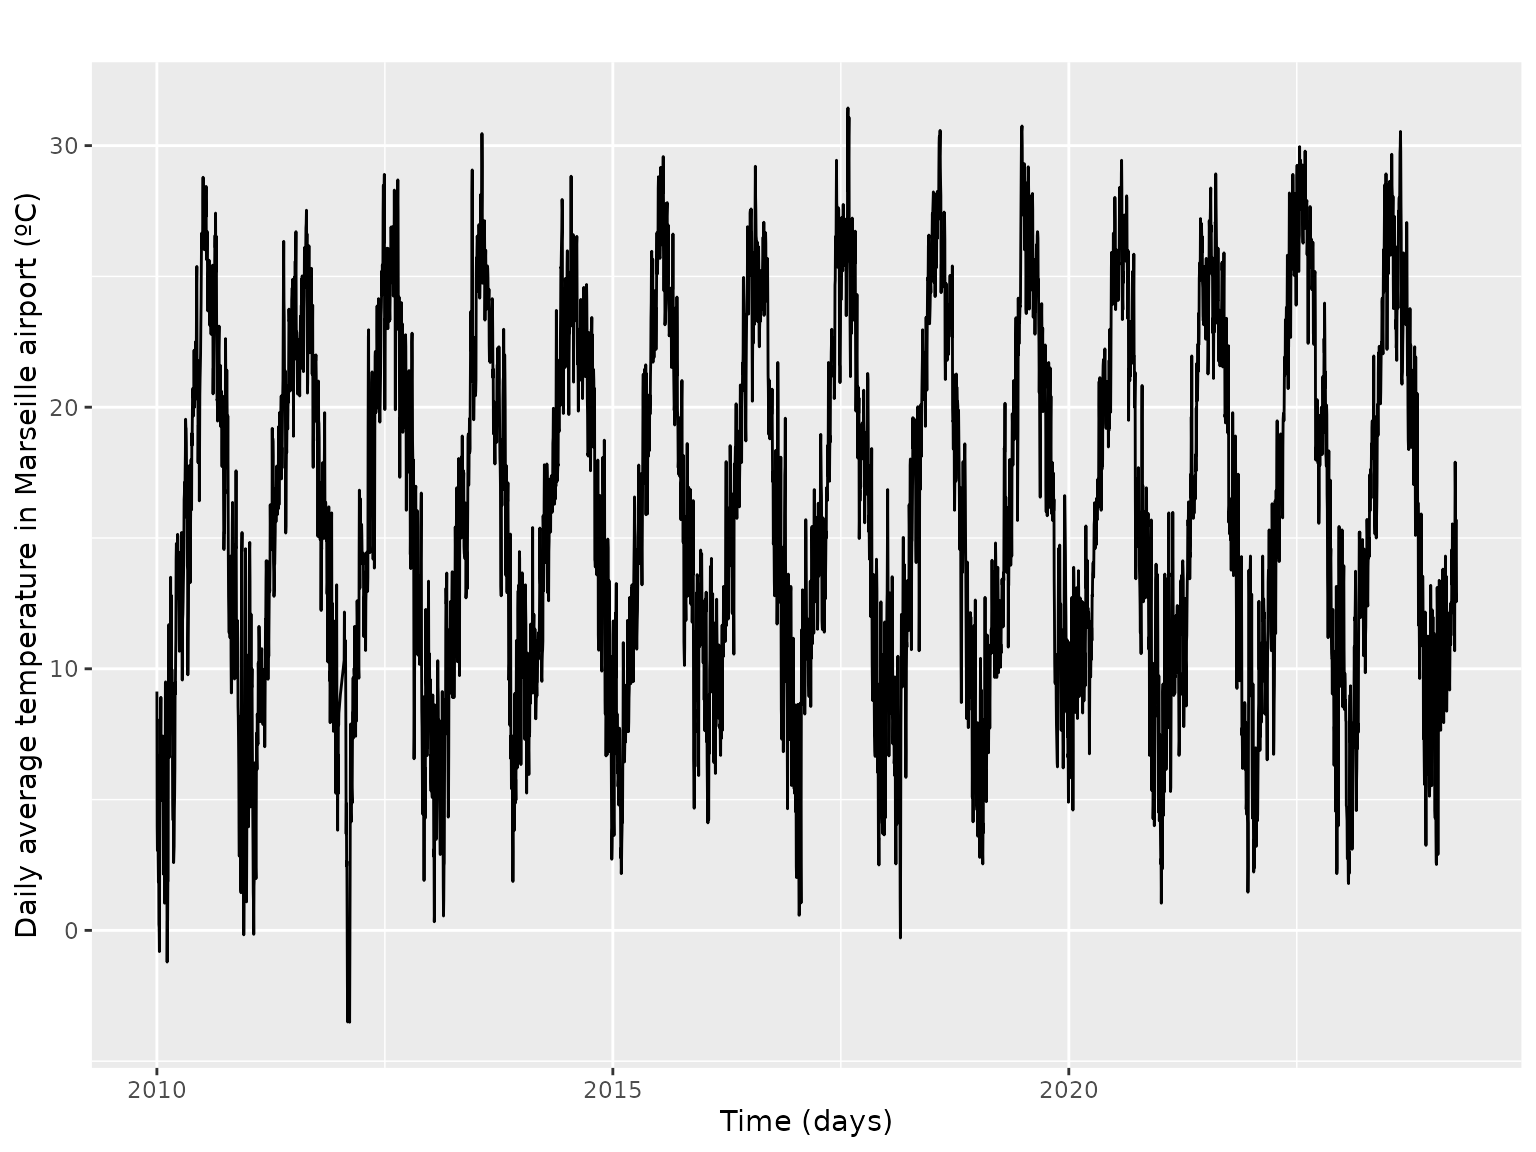
Forecast for Marseille
For this we use the forecast package. We use the
stlm because our time series obviously present yearly
seasonality.
fit <- stlm(marseille_ts)## Warning in ets(x, model = etsmodel, allow.multiplicative.trend =
## allow.multiplicative.trend, : Non-integer seasonal period. Only non-seasonal
## models will be considered.
pred <- forecast(fit, h = 7)
# plot
theme_set(theme_gray(base_size = 14))
autoplot(pred) +
ylab("Daily average temperature in Marseille airport (ºC)") +
xlab("Time (days)") +
ggtitle("How cold will I be during the holidays?",
subtitle = "Data accessed via the rOpenSci riem package and forecasted with forecast"
)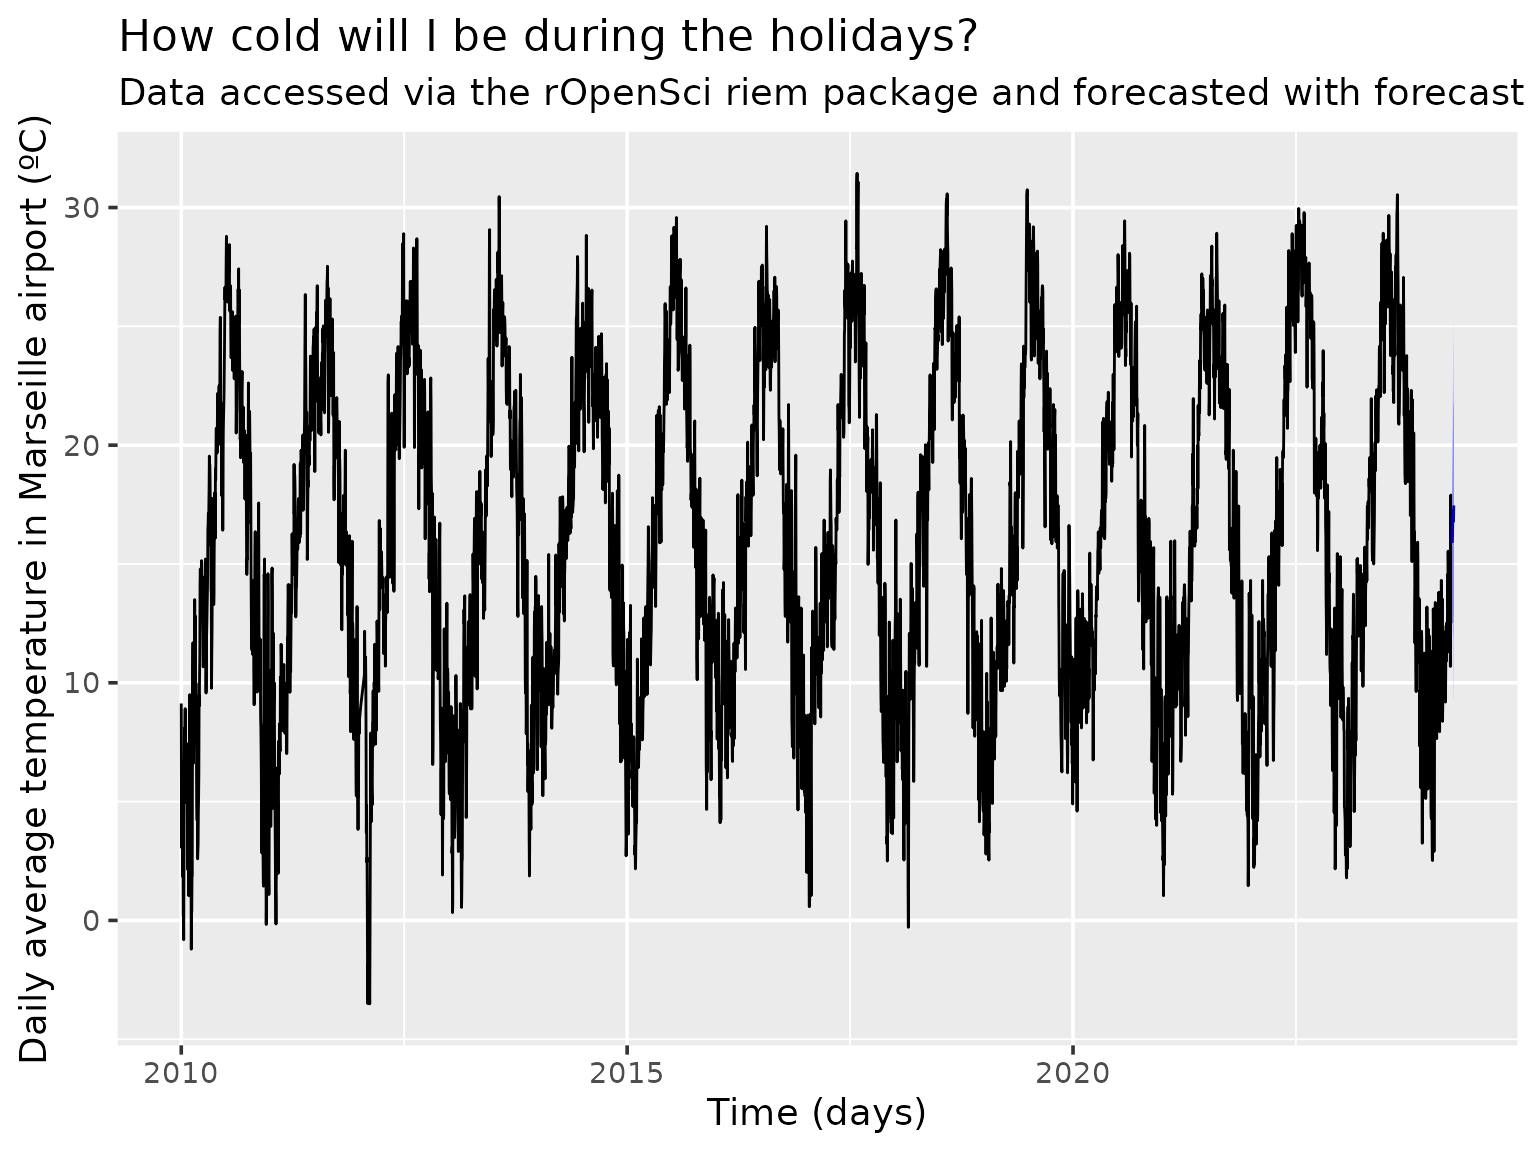
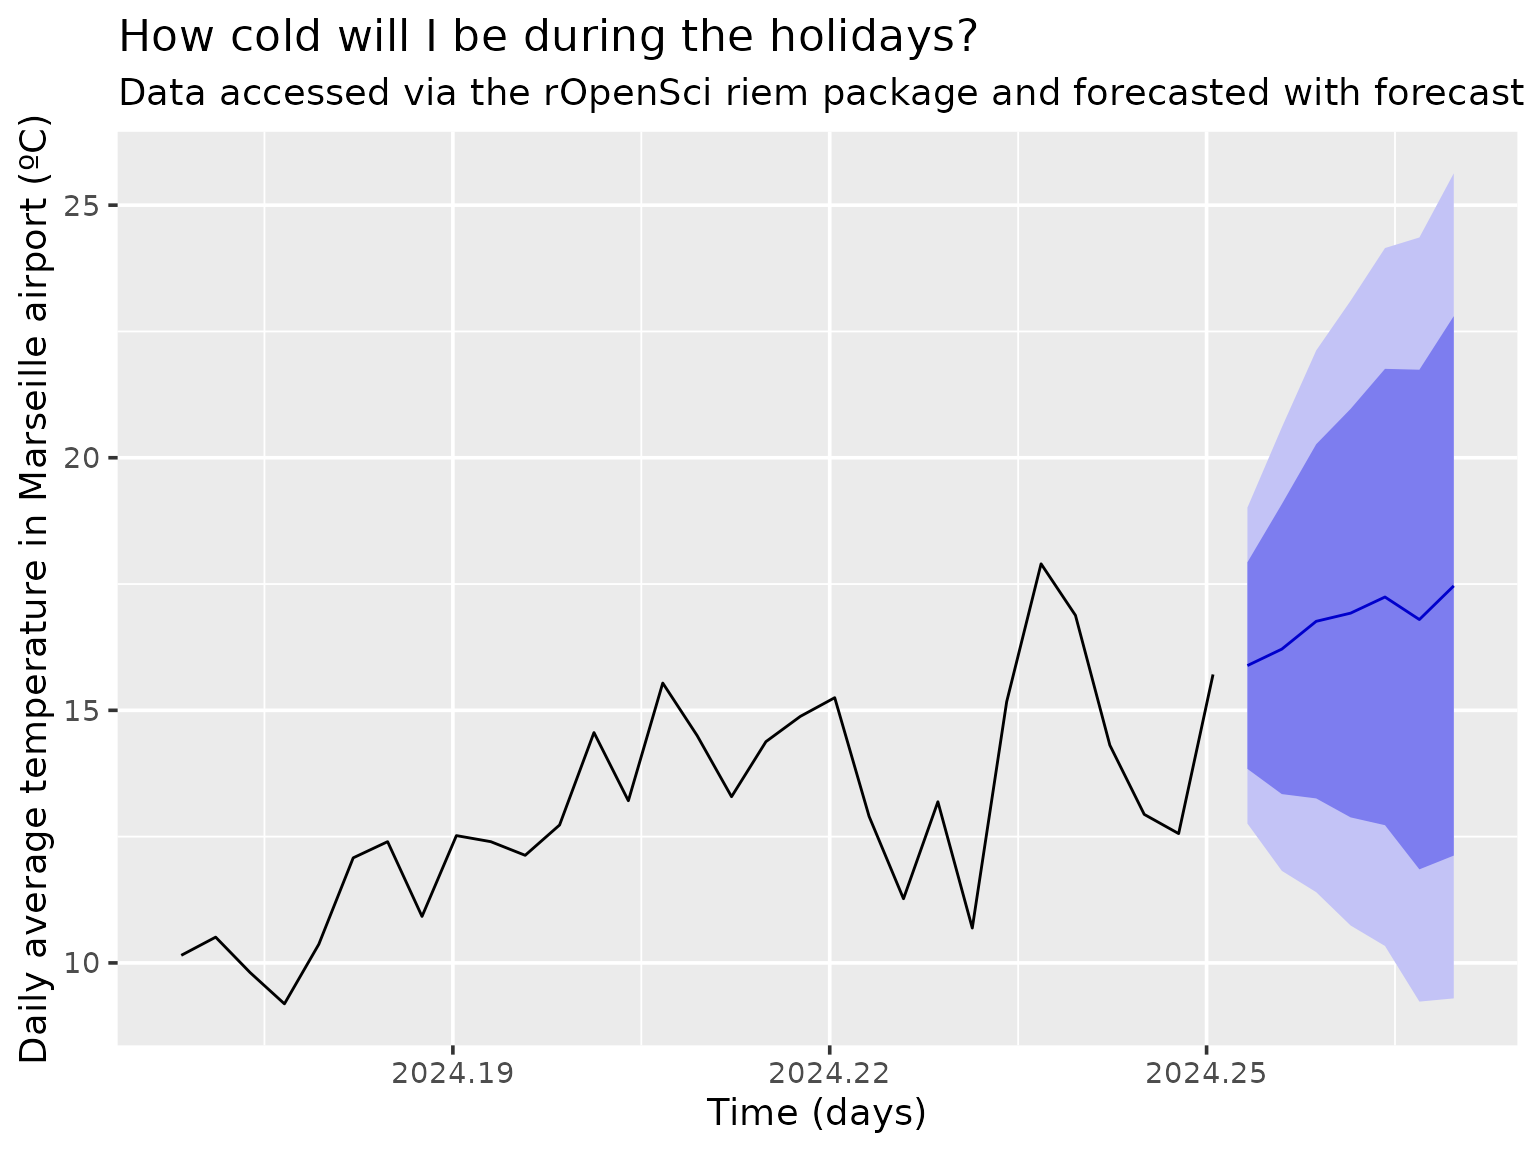
Mmh I don’t see anything, but autoplot.forecast has an
include parameters, so I’ll only plot the last 31
values.
autoplot(pred, include = 31) +
ylab("Daily average temperature in Marseille airport (ºC)") +
xlab("Time (days)") +
ggtitle("How cold will I be during the holidays?",
subtitle = "Data accessed via the rOpenSci riem package and forecasted with forecast"
)
What if I went somewhere else?
Ok, what if I had travelled to, say, Hyderabad in India?
## Warning in ets(x, model = etsmodel, allow.multiplicative.trend =
## allow.multiplicative.trend, : Non-integer seasonal period. Only non-seasonal
## models will be considered.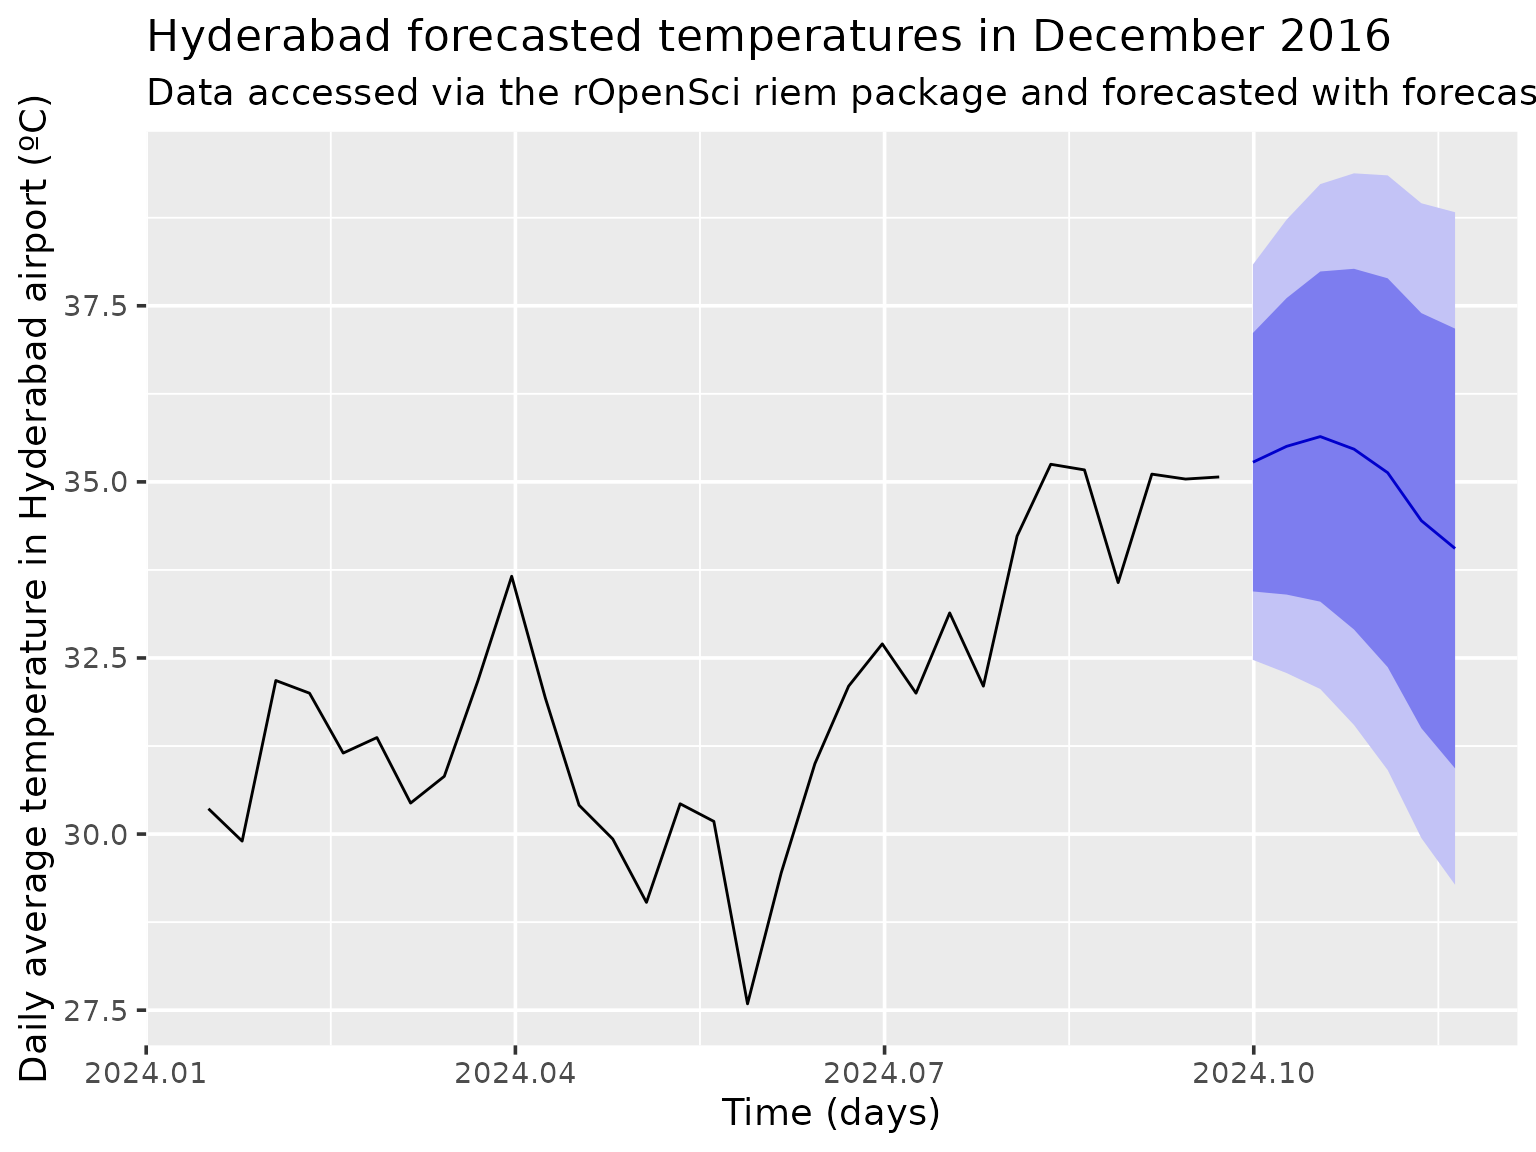
Without surprise, we forecast I’d have enjoyed warmer weather.
I wouldn’t advise you to really use such code to forecast
temperature, but I’d recommend you to use riem for getting
weather airport data quite easily and to dig more deeply into
forecast functionalities if you’re interested in time
series forecasting. And stay warm!