Reproducing Reported road casualties in Great Britain: pedestrian factsheet
Blaise Kelly
2025-10-02
Source:vignettes/Pedestrian_factsheet_2024.Rmd
Pedestrian_factsheet_2024.RmdIntroduction
This document aims to reproduce the 2020-2024 sections of the “Accredited official statistics Reported road casualties in Great Britain: pedestrian factsheet, 2024” report published on 25th September 2025.
1. Main findings
Between 2004 and 2024:
- fatalities were down 39% from 671 to 409
- serious injuries (adjusted) decreased by 42%
- pedestrian traffic (distance walked) increased by 23%
Averaged over the period 2020 to 2024:
an average of 7 pedestrians died and 103 were seriously injured (adjusted) per week in reported road collisions
a majority of pedestrian fatalities (%) do not occur at or within 20m of a junction compared to % of all seriously injured (adjusted) casualties
55% of pedestrian fatalities were in collisions involving a single car
% of pedestrian fatalities occurred on rural roads compared to % of all pedestrian casualties
57% of pedestrian killed or seriously injured (KSI) (adjusted) casualties were male
The most common contributory factor allocated to pedestrians no contributory factors included in the public data
2. Pedestrian traffic and reported casualties
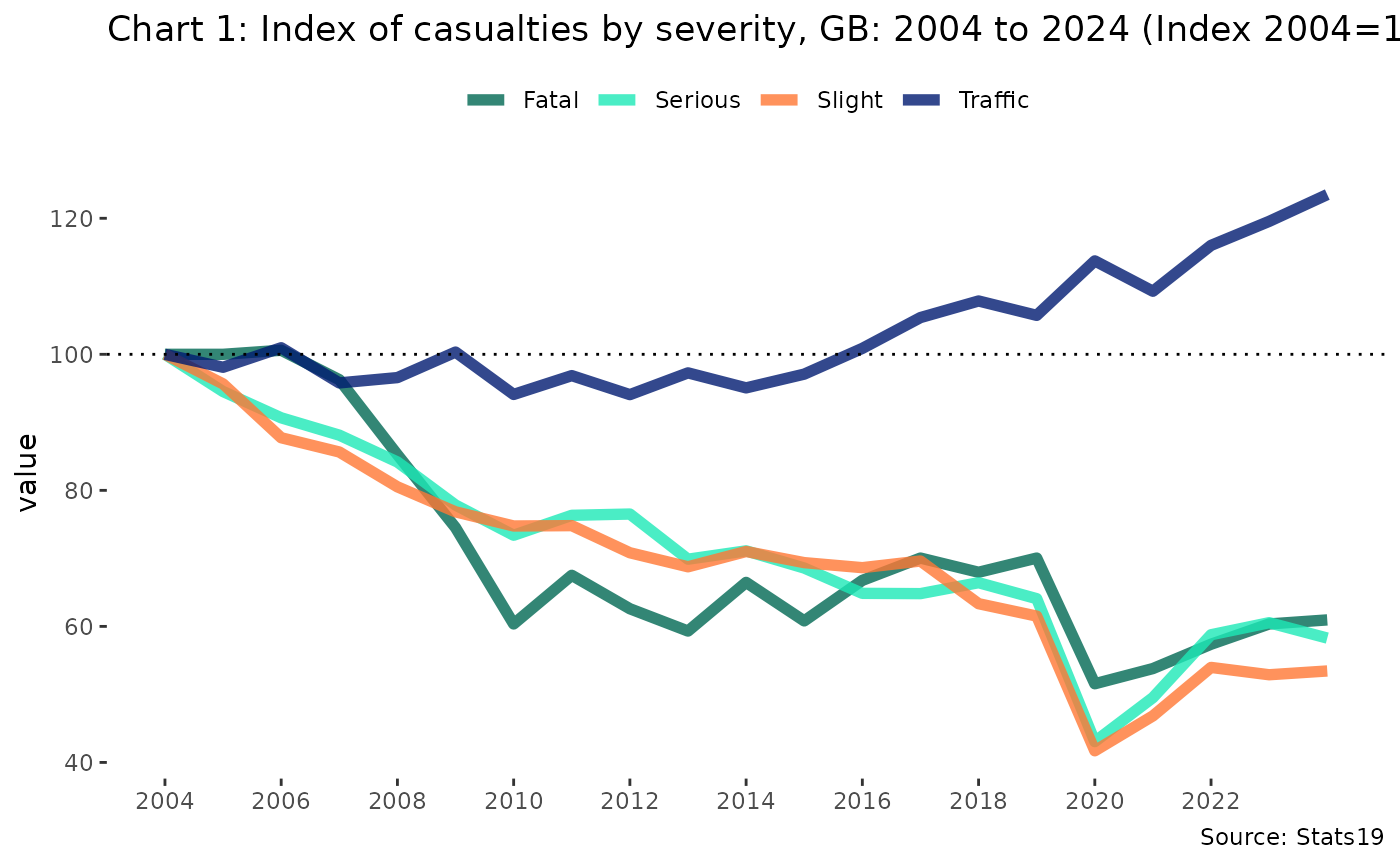
In 2024, 409 pedestrians were killed in Great Britain, whilst 5823 were reported to be seriously injured and 12944 slightly injured.
Table 1 and Chart 1 show that pedestrian traffic (measured by distance walked) has increased between 2004 and 2024 whilst fatalities, serious and slight injuries have fallen.
Between 2023 and 2024, pedestrian fatalities increased by 1% while pedestrian traffic (distance walked) increased by 3%.
| Table 1: Number of reported pedestrian casualties by severity and traffic (pedestrian billion miles walked), GB: 2004 to 2024 | |||||
| Year | Killed | Serious | Slight | All | Traffic |
|---|---|---|---|---|---|
| 2004 | 671 | 9992 | 24218 | 34881 | 12.89 |
| 2005 | 671 | 9445 | 23165 | 33281 | 12.64 |
| 2006 | 675 | 9059 | 21248 | 30982 | 13.01 |
| 2007 | 646 | 8804 | 20741 | 30191 | 12.35 |
| 2008 | 572 | 8410 | 19500 | 28482 | 12.45 |
| 2009 | 500 | 7777 | 18610 | 26887 | 12.93 |
| 2010 | 405 | 7334 | 18106 | 25845 | 12.13 |
| 2011 | 453 | 7627 | 18118 | 26198 | 12.49 |
| 2012 | 420 | 7645 | 17153 | 25218 | 12.13 |
| 2013 | 398 | 6982 | 16653 | 24033 | 12.54 |
| 2014 | 446 | 7105 | 17197 | 24748 | 12.25 |
| 2015 | 408 | 6852 | 16801 | 24061 | 12.51 |
| 2016 | 448 | 6480 | 16622 | 23550 | 13.00 |
| 2017 | 470 | 6476 | 16859 | 23805 | 13.59 |
| 2018 | 456 | 6637 | 15339 | 22432 | 13.90 |
| 2019 | 470 | 6402 | 14898 | 21770 | 13.63 |
| 2020 | 346 | 4302 | 10102 | 14750 | 14.66 |
| 2021 | 361 | 4949 | 11344 | 16654 | 14.08 |
| 2022 | 385 | 5872 | 13070 | 19327 | 14.95 |
| 2023 | 405 | 6049 | 12809 | 19263 | 15.41 |
| 2024 | 409 | 5823 | 12944 | 19176 | 15.92 |
| Source: DfT STATS19, National Travel Survey and Office for National Statistics population data | |||||
3. How far do pedestrians travel?
The National Travel Survey (NTS) which provides the number of trips and average distance travelled (NTS0303) by person per year for English residents. This is used to derive casualty rates per mile travelled for pedestrians, which also use the Great Britain population figure to estimate total distance walked each year.
4. Casualty rates per mile travelled
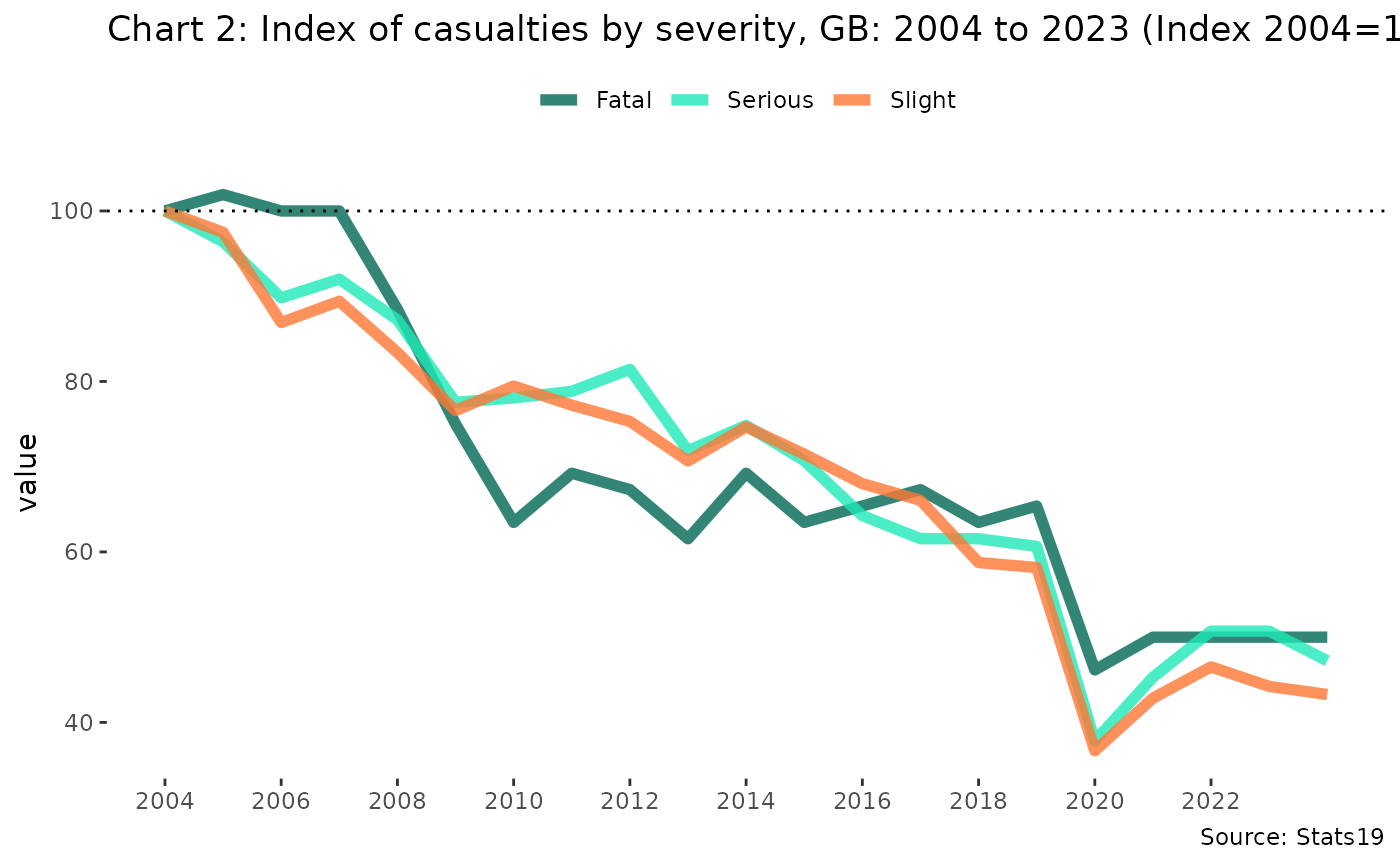
The pedestrian casualty rate has fallen for all severities in 2024 compared to 2004.
The overall casualty rate decreased by 55%. The fatality rate decreased by 50% compared to a 53% reduction for serious injuries and a 57% reduction for slight injuries.
| Table 2: Casualty rates of pedestrian casualties by severity per billion miles walked, GB: 2004 to 2024 | ||||
| Year | Killed | Serious | Slight | All |
|---|---|---|---|---|
| 2004 | 52 | 775 | 1879 | 2706 |
| 2005 | 53 | 747 | 1832 | 2632 |
| 2006 | 52 | 696 | 1633 | 2381 |
| 2007 | 52 | 713 | 1680 | 2445 |
| 2008 | 46 | 676 | 1567 | 2288 |
| 2009 | 39 | 601 | 1439 | 2079 |
| 2010 | 33 | 605 | 1493 | 2131 |
| 2011 | 36 | 611 | 1451 | 2098 |
| 2012 | 35 | 631 | 1415 | 2080 |
| 2013 | 32 | 557 | 1328 | 1917 |
| 2014 | 36 | 580 | 1403 | 2020 |
| 2015 | 33 | 548 | 1343 | 1923 |
| 2016 | 34 | 498 | 1278 | 1811 |
| 2017 | 35 | 477 | 1241 | 1752 |
| 2018 | 33 | 477 | 1104 | 1614 |
| 2019 | 34 | 470 | 1093 | 1598 |
| 2020 | 24 | 293 | 689 | 1006 |
| 2021 | 26 | 351 | 805 | 1182 |
| 2022 | 26 | 393 | 874 | 1292 |
| 2023 | 26 | 393 | 831 | 1250 |
| 2024 | 26 | 366 | 813 | 1205 |
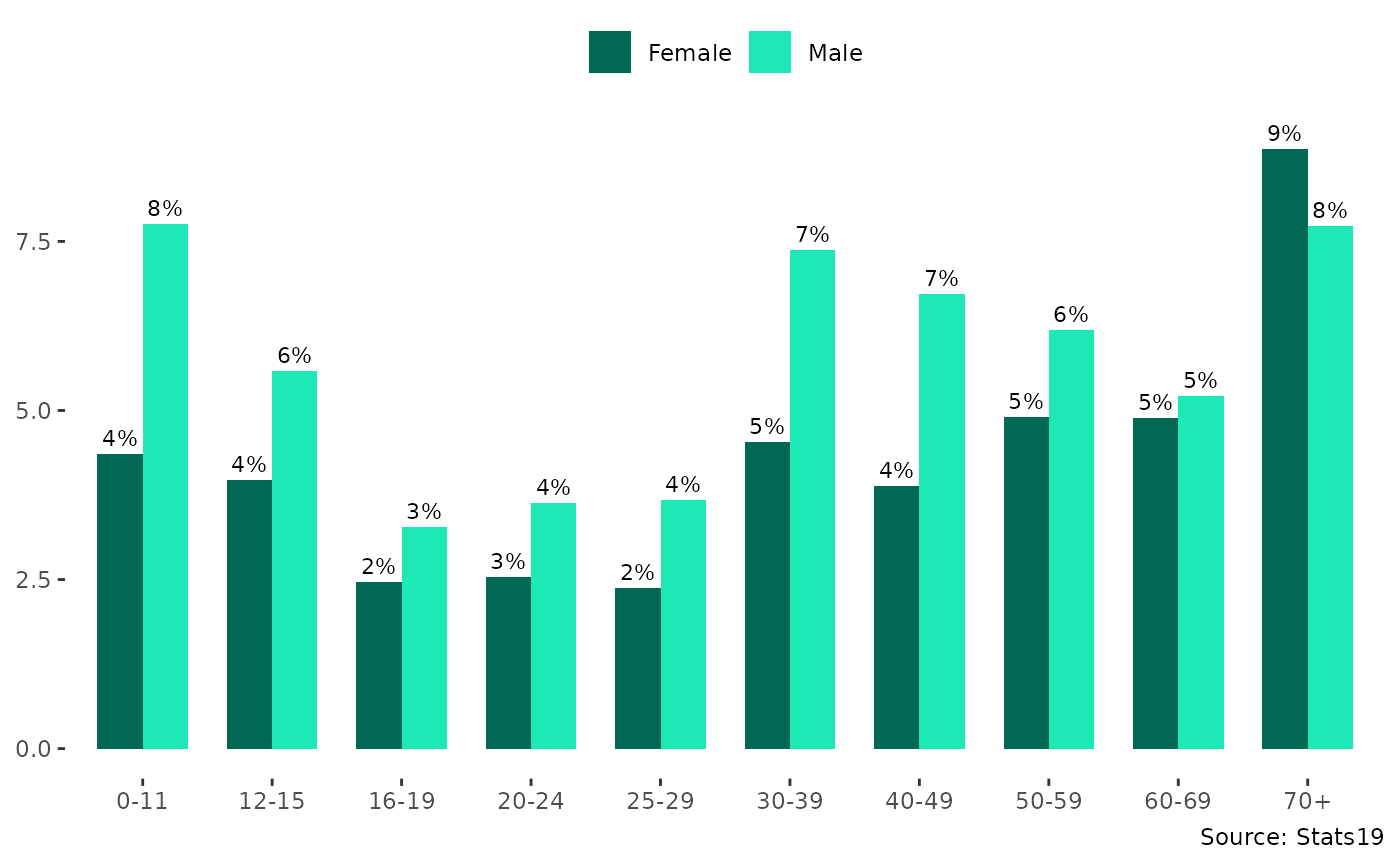
5. Sex and age comparisons
Between 2020 and 2024, 57% of pedestrian casualties were male and 43% female.
There are 1.3 times more male than female pedestrian casualties overall. This compares to 1.6 more for 30-39, 1.8 more for 0-11and 0.9 more for 70+ - the only age group in which female casualties outnumber males.
6. Which vehicles are involved in collisions with pedestrians?
Between 2020 and 2024, most pedestrian fatalities occurred in 1 vehicle collisions involving a car (1043).
However, the highest proportion of casualties from single vehicle collisions involve 1 heavy goods vehicle (16.4%). The second highest proportion (10.5%) occurred in collisions when 3 or more other vehicles involved.
| Table 3: Pedestrian casualties in reported road collisions by severity showing other vehicles involved GB: 2020 to 2024 | |||||
| Vehicles | Fatalities | Serious injuries | Slight injuries | All casualties | % Fatalities |
|---|---|---|---|---|---|
| 1 pedal cycle | 9 | 738 | 1430 | 2177 | 0.4 |
| 1 motorcycle | 51 | 1167 | 2447 | 3665 | 1.4 |
| 1 car | 1043 | 19300 | 44608 | 64951 | 1.6 |
| 1 bus or coach | 96 | 924 | 1809 | 2829 | 3.4 |
| 1 light goods vehicle | 165 | 1936 | 4177 | 6278 | 2.6 |
| 1 heavy goods vehicle | 176 | 394 | 502 | 1072 | 16.4 |
| 1 other vehicle | 45 | 681 | 1565 | 2291 | 2.0 |
| 2 vehicles involved | 201 | 1432 | 3151 | 4784 | 4.2 |
| 3 or more other vehicles involved | 118 | 422 | 580 | 1120 | 10.5 |
| Total | 1904 | 26994 | 60269 | 89167 | 2.1 |
7. Time of day of collisions
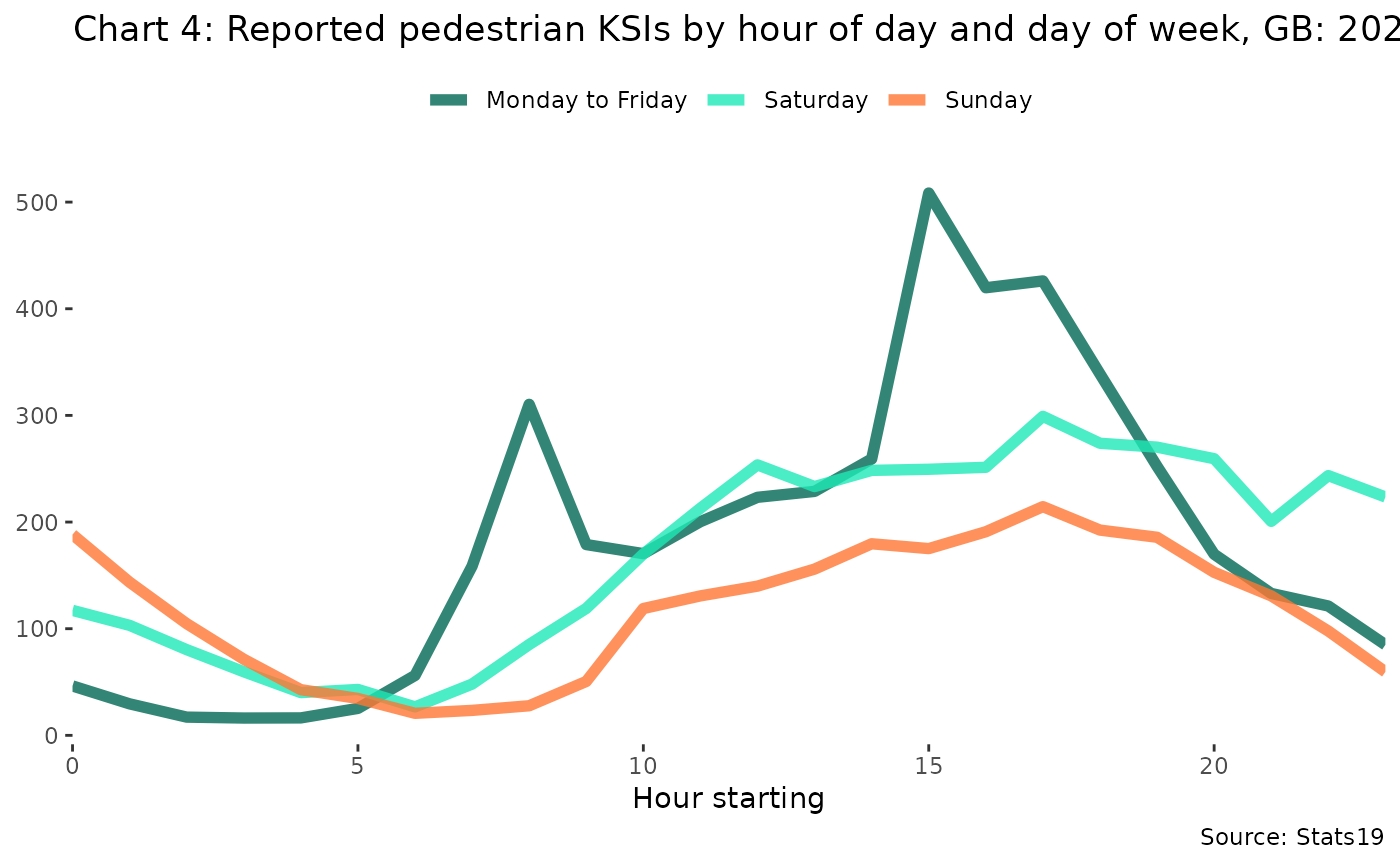
The weekday peak time for pedestrian KSIs is from 3pm to 6pm. By contrast, the peak is from 4pm to 7pm at weekends.
8. What type of road?
Chart 5 shows that between 2020 and 2024, % of pedestrian fatalities occurred on urban roads compared to % of all pedestrian casualties. % of pedestrian fatalities occurred on motorways. This would be people outside their vehicles whether they are moving at the time or not.
In this report, urban roads are defined as those within an area of population of 10,000 or more in England and Wales or more than 3,000 in Scotland - roads outside of these areas are classified as rural https://www.gov.uk/government/publications/road-length-statistics-information/road-lengths-in-great-britain-statistics-notes-and-definitions.
9. Vehicle movement on the road
A majority of pedestrian fatalities (61.5%) occur 0 compared to 49.8% of serious injuries (adjusted). However, 0% of fatalities occur at a junction compared to 0% of serious injuries (adjusted). Pedestrian fatalities at roundabouts represent 0% of all fatalities in contrast to 0% of serious injuries (adjusted).
| Table 4: Percentage of pedestrian KSI casualties by severity and junction detail where the collision occurred, GB: 2020 to 2024 | ||||
| Junction | Fatalities | Serious | Slight | All casualties |
|---|---|---|---|---|
| 0 | 61.5% | 49.8% | 48.7% | 49.3% |
| 13 | 23.3% | 30.2% | 30% | 29.9% |
| -1 | 5.8% | 8% | 9.9% | 9.2% |
| 16 | 7.1% | 8.2% | 7.5% | 7.7% |
| 18 | 1.6% | 1.8% | 2.1% | 2% |
| 17 | 0.7% | 2% | 1.7% | 1.8% |
| 99 | 0% | 0% | 0% | 0% |
Sections 10 not reproducible as data is not public and sections 11 and 14 are simply explanatory text.