Visualise binary values
Usage
vis_binary(
  data,
  col_zero = "salmon",
  col_one = "steelblue2",
  col_na = "grey90",
  order = NULL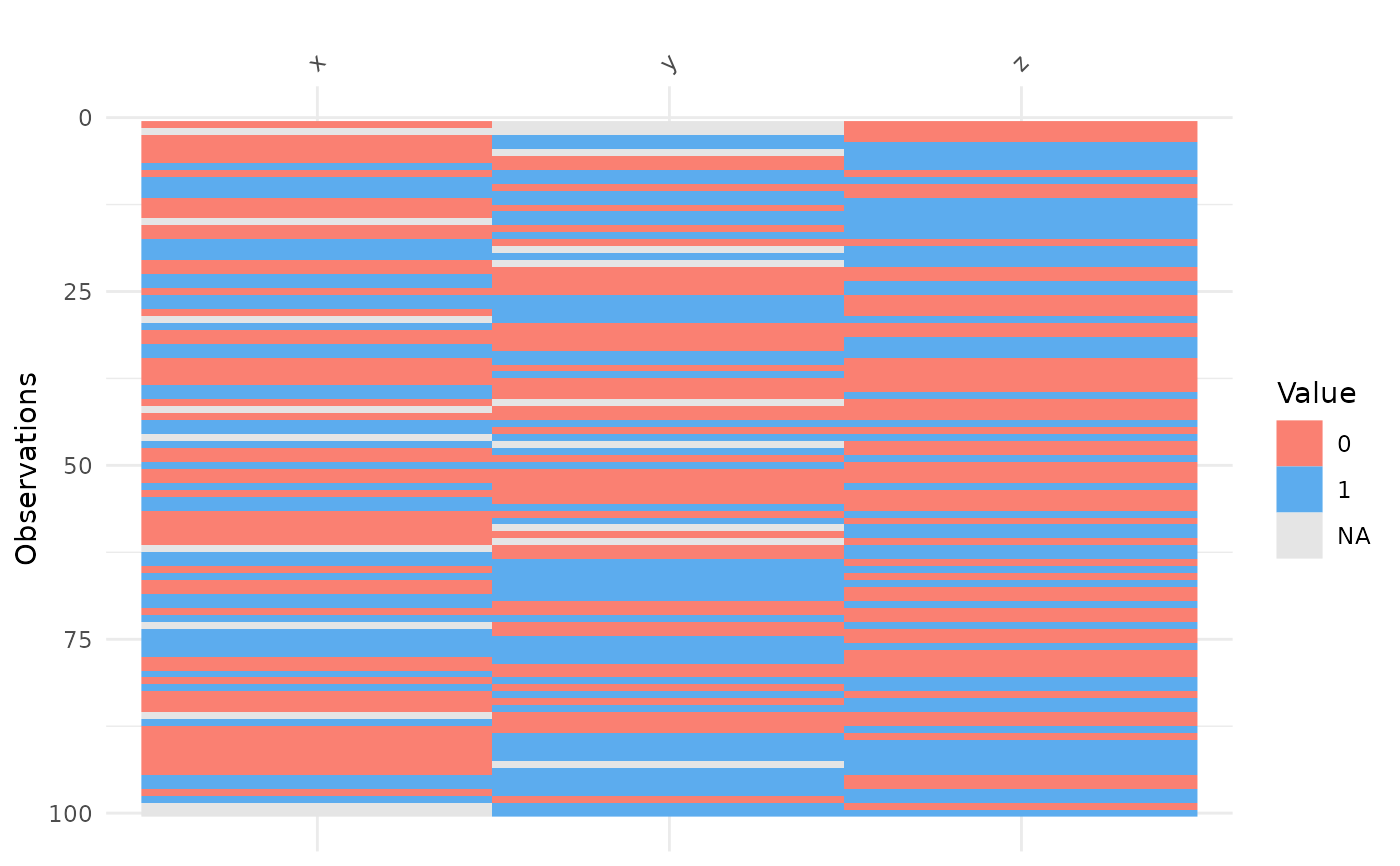
)Examples
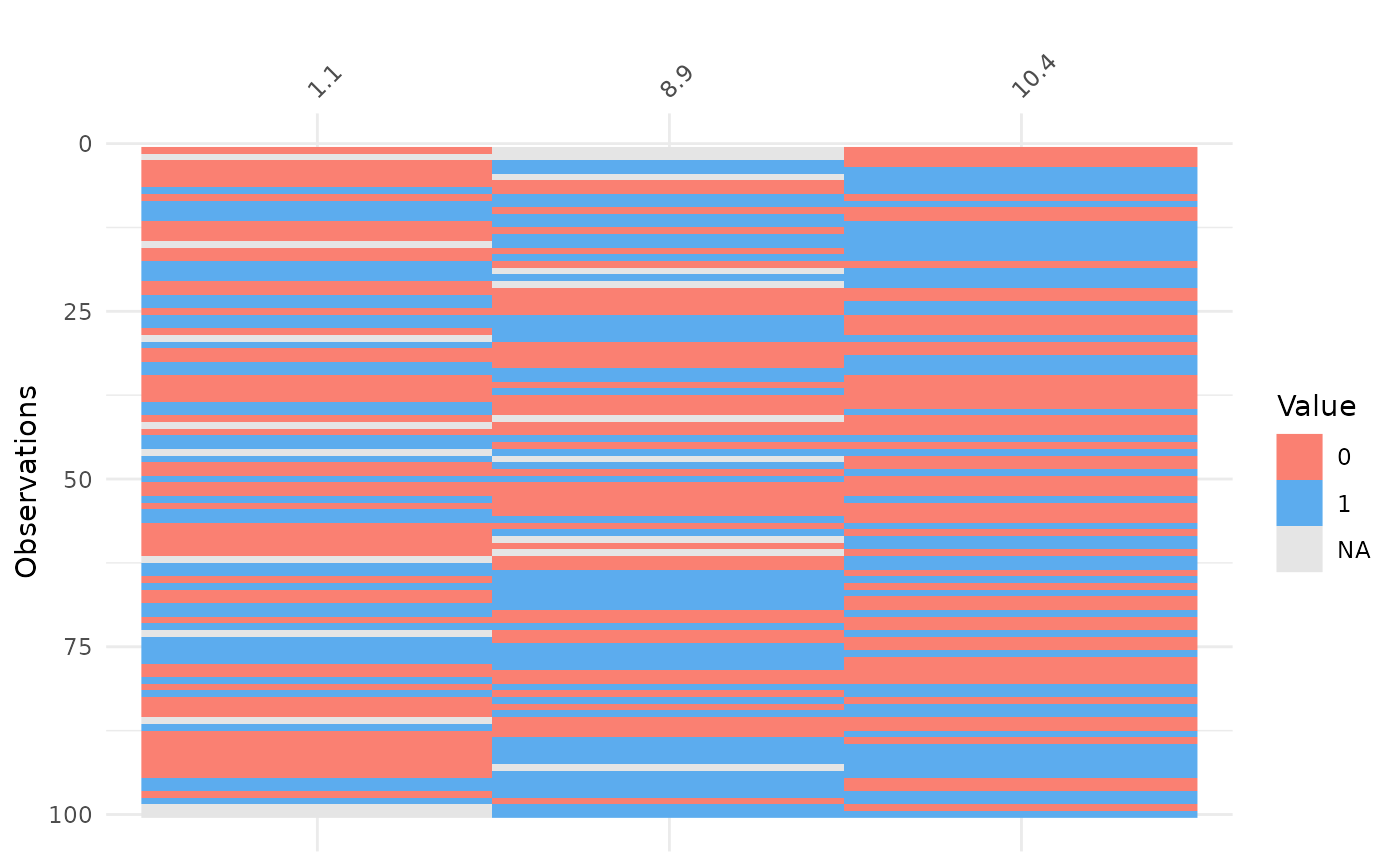
vis_binary(dat_bin)
 # changing order of variables
# create numeric names
df <- setNames(dat_bin, c("1.1", "8.9", "10.4"))
df
#> # A tibble: 100 × 3
#> `1.1` `8.9` `10.4`
#> <int> <int> <int>
#> 1 0 NA 0
#> 2 NA NA 0
#> 3 0 1 0
#> 4 0 1 1
#> 5 0 NA 1
#> 6 0 0 1
#> 7 1 0 1
#> 8 0 1 0
#> 9 1 1 1
#> 10 1 0 0
#> # ℹ 90 more rows
# not ideal
vis_binary(df)
# changing order of variables
# create numeric names
df <- setNames(dat_bin, c("1.1", "8.9", "10.4"))
df
#> # A tibble: 100 × 3
#> `1.1` `8.9` `10.4`
#> <int> <int> <int>
#> 1 0 NA 0
#> 2 NA NA 0
#> 3 0 1 0
#> 4 0 1 1
#> 5 0 NA 1
#> 6 0 0 1
#> 7 1 0 1
#> 8 0 1 0
#> 9 1 1 1
#> 10 1 0 0
#> # ℹ 90 more rows
# not ideal
vis_binary(df)
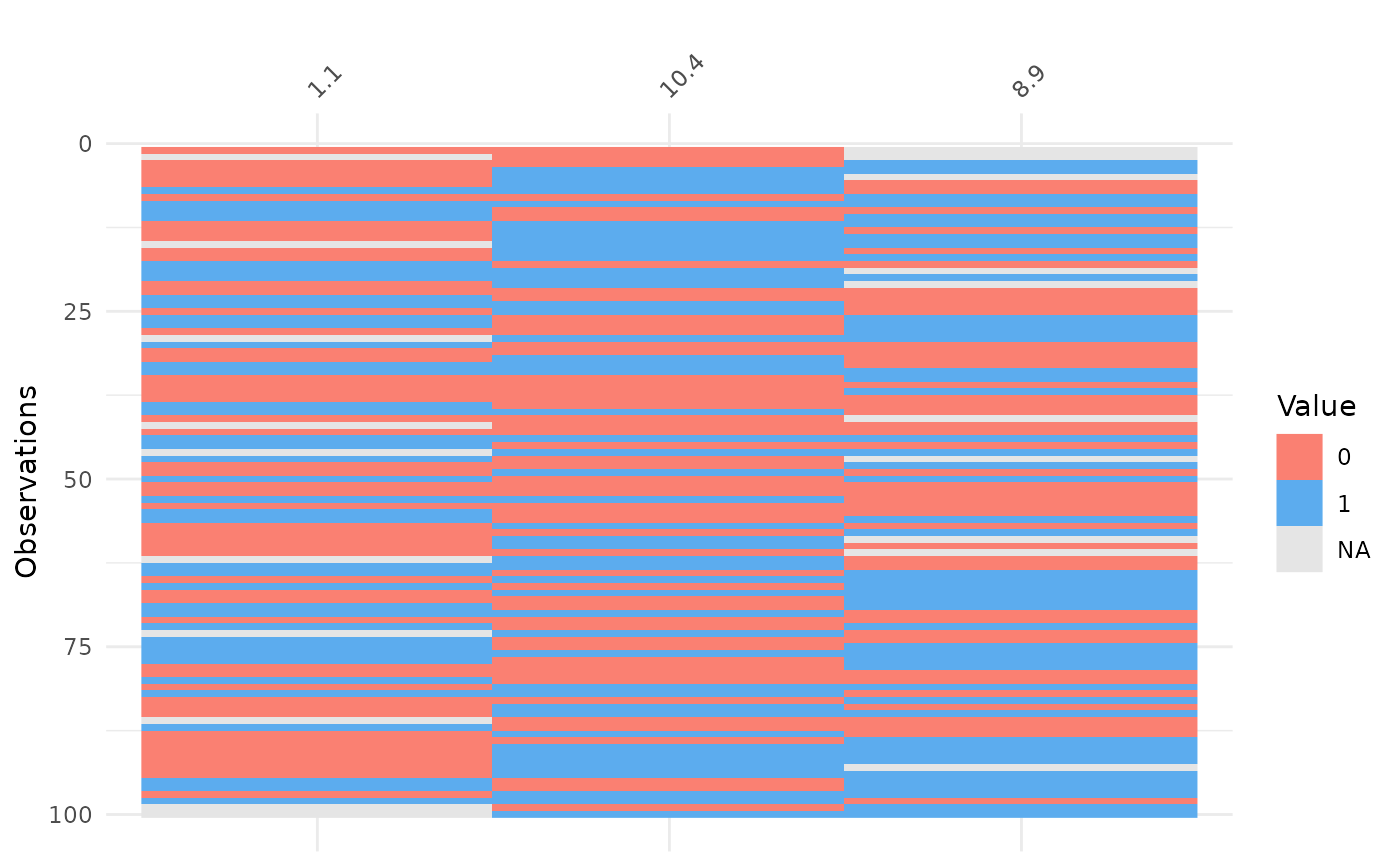 # good - specify the original order
vis_binary(df, order = names(df))
# good - specify the original order
vis_binary(df, order = names(df))