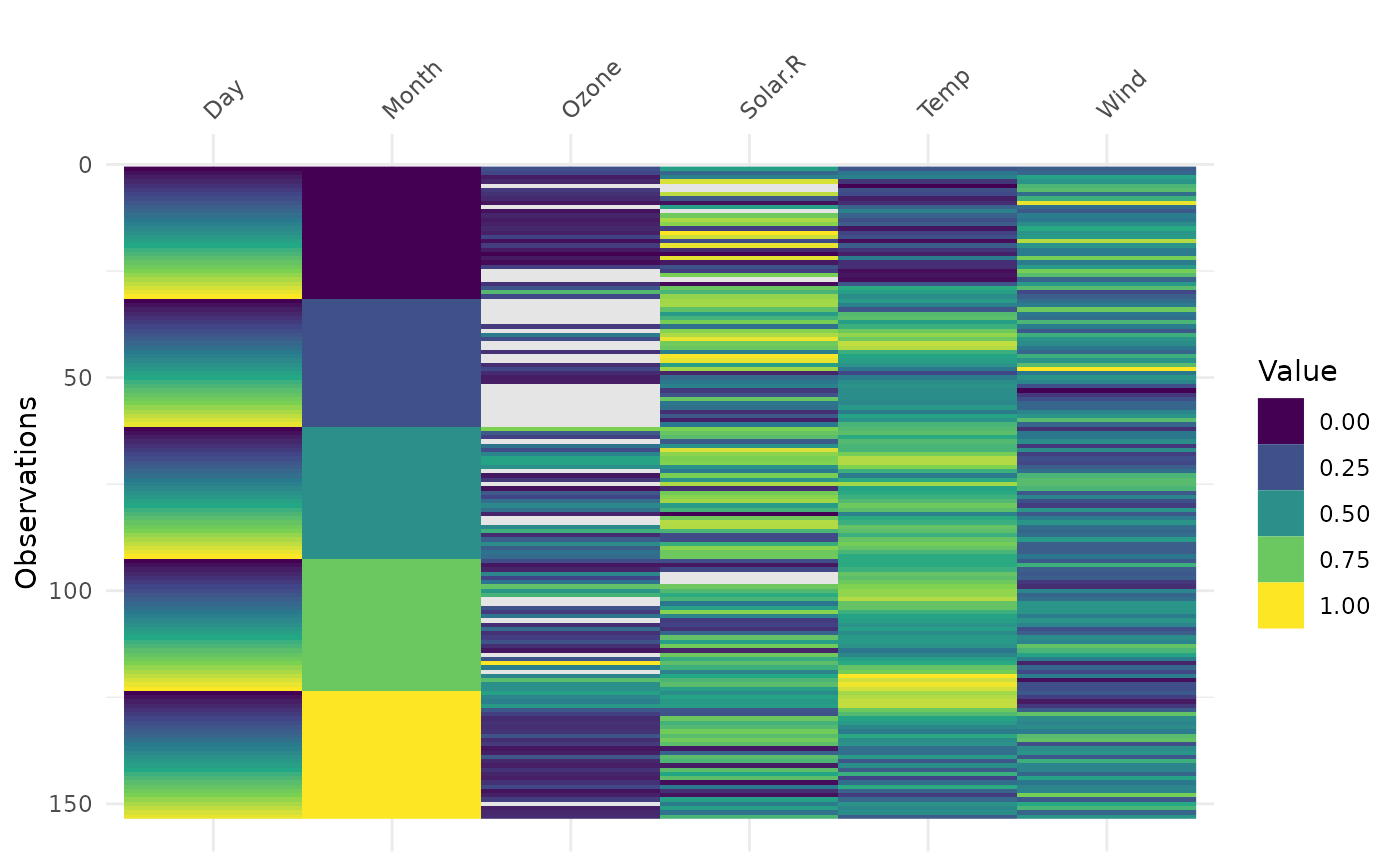
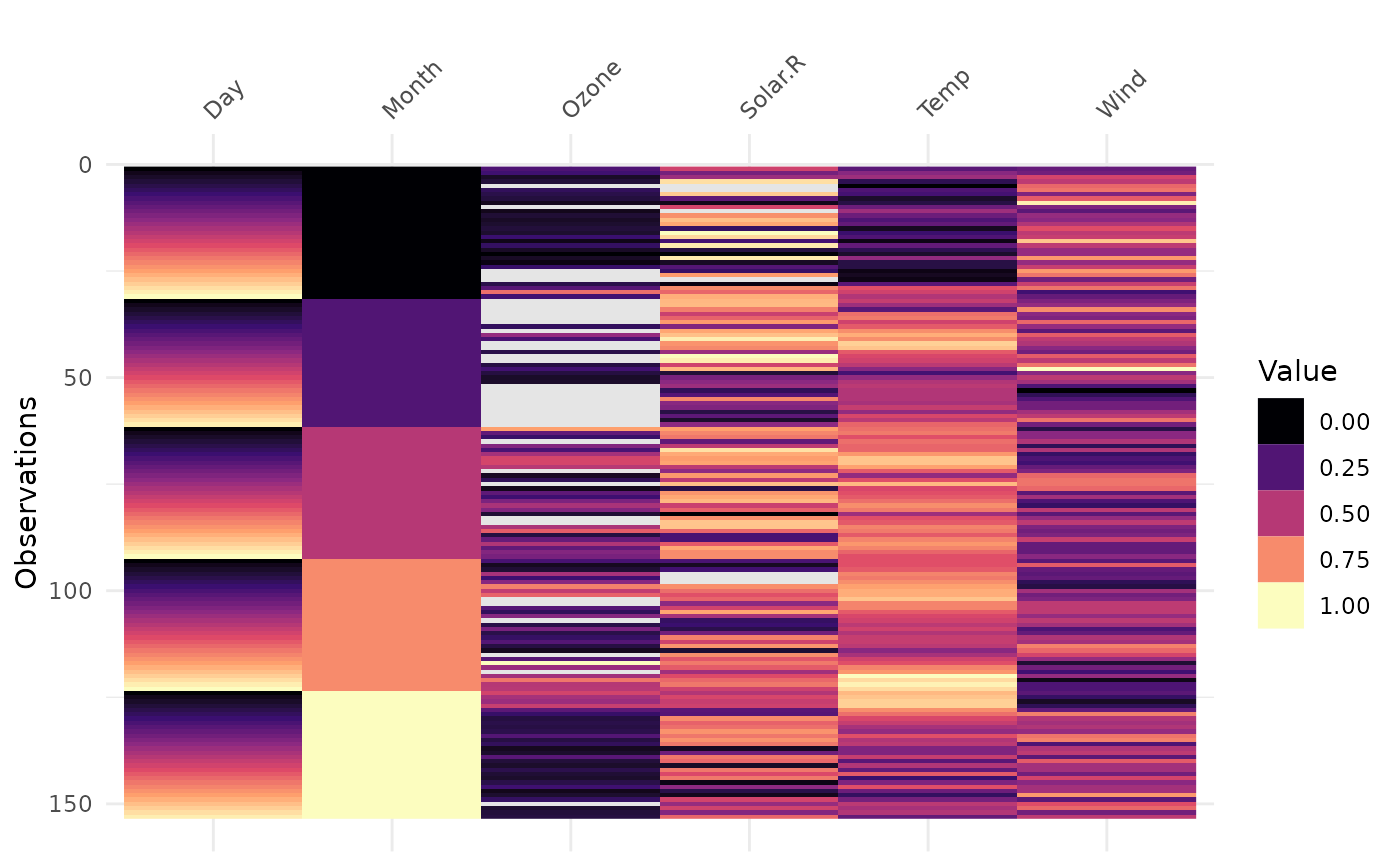
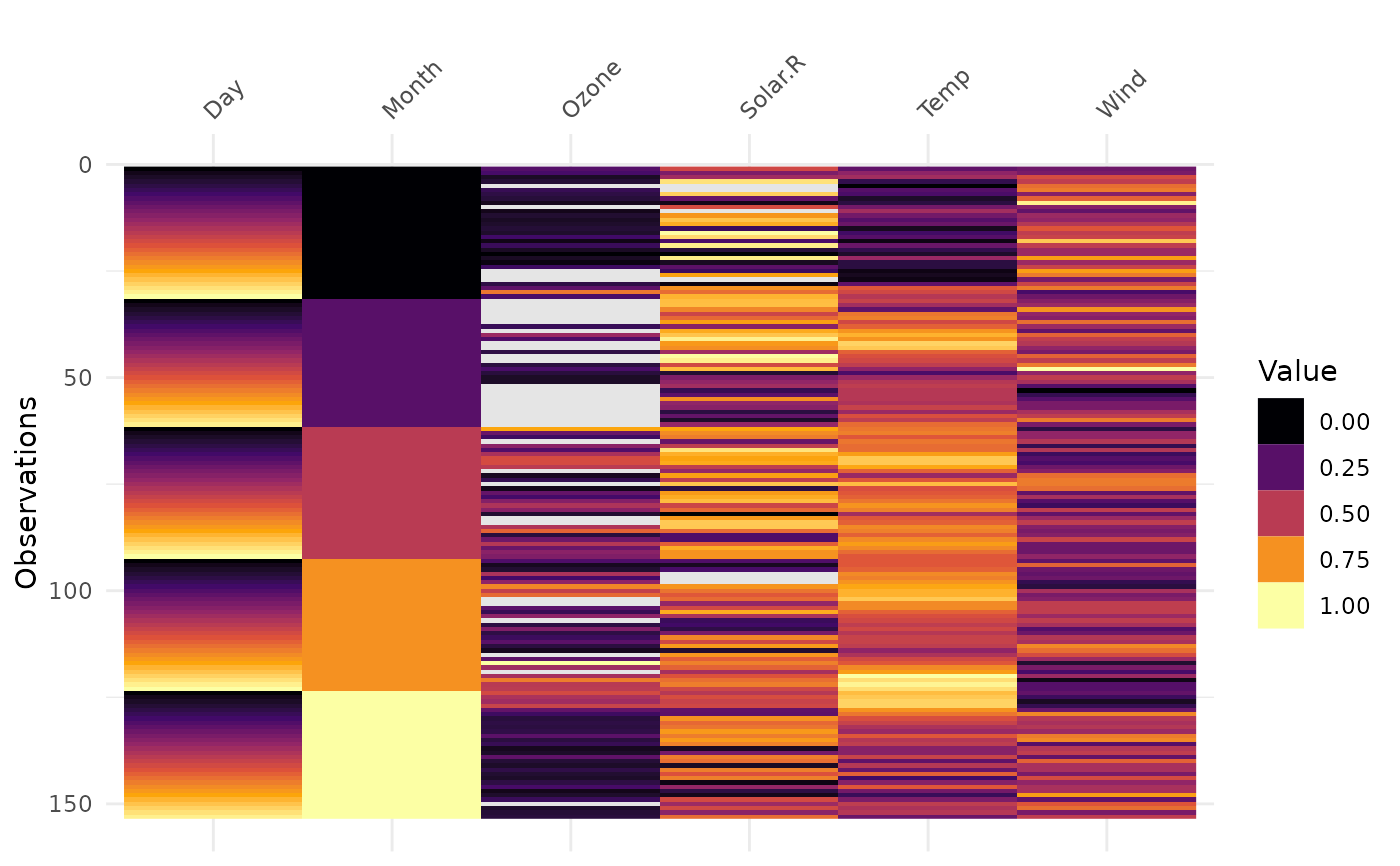
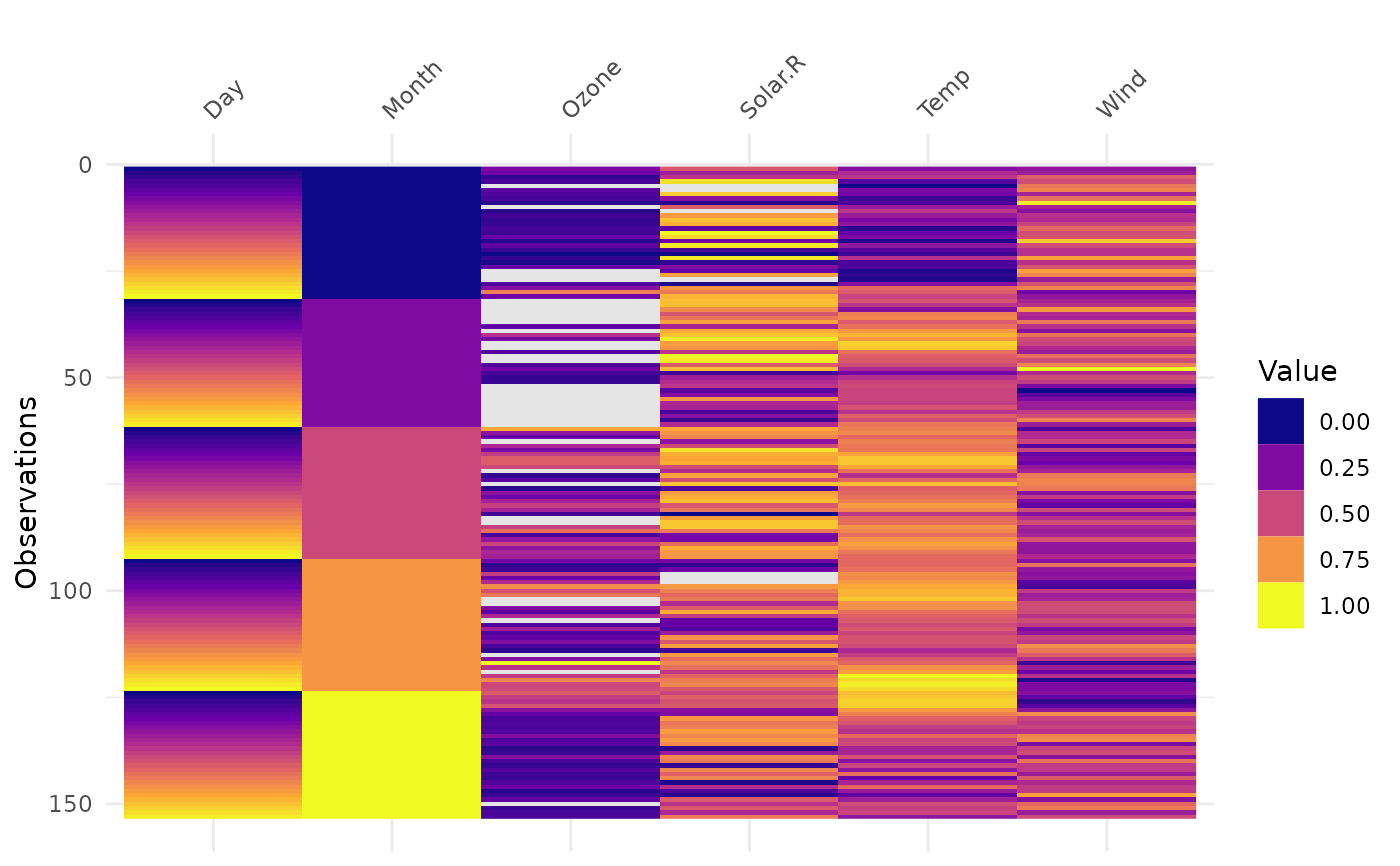
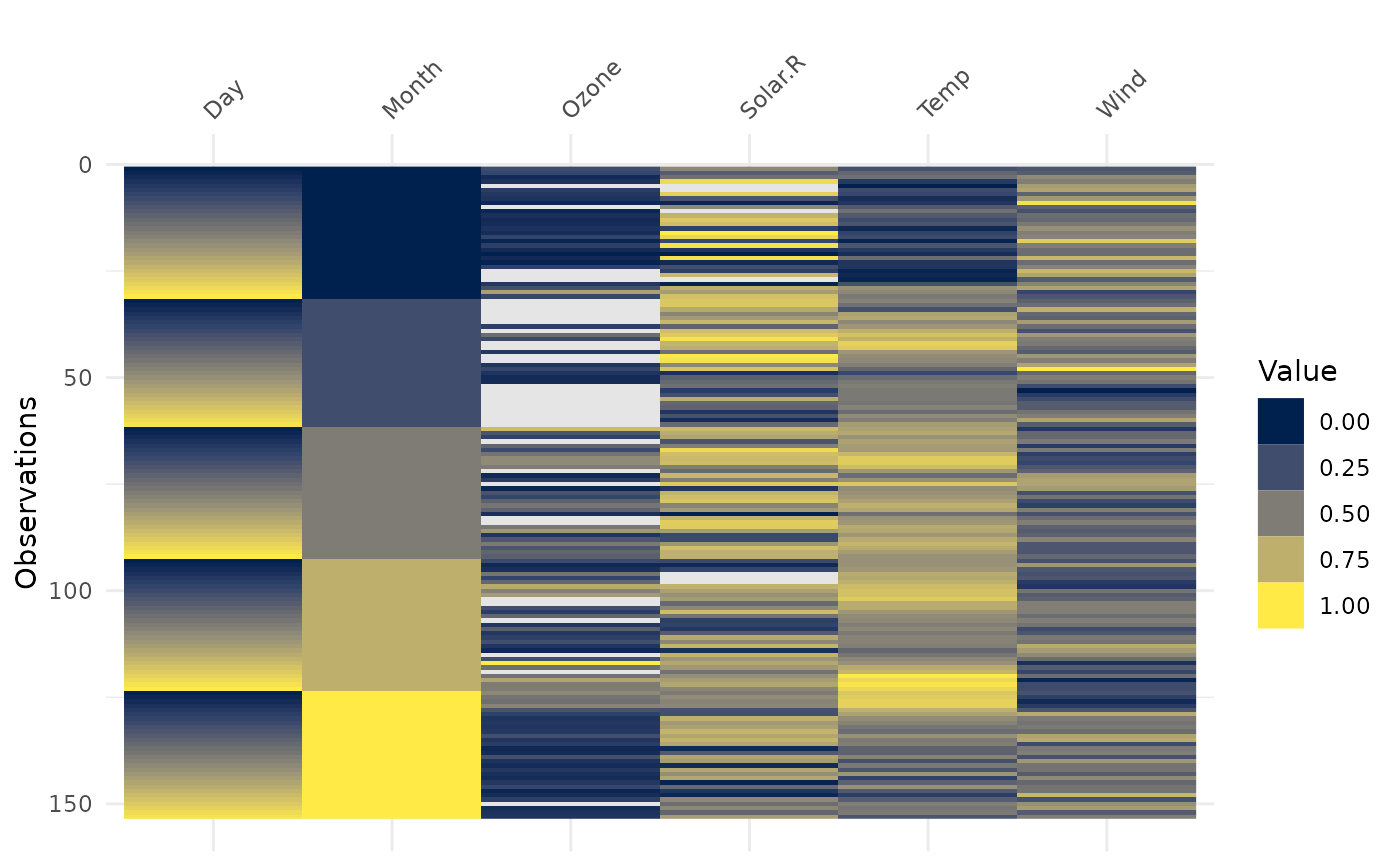
Visualise all of the values in the data on a 0 to 1 scale. Only works on numeric data - see examples for how to subset to only numeric data.
Arguments
- data
a data.frame
- na_colour
a character vector of length one describing what colour you want the NA values to be. Default is "grey90"
- viridis_option
A character string indicating the colormap option to use. Four options are available: "magma" (or "A"), "inferno" (or "B"), "plasma" (or "C"), "viridis" (or "D", the default option) and "cividis" (or "E").