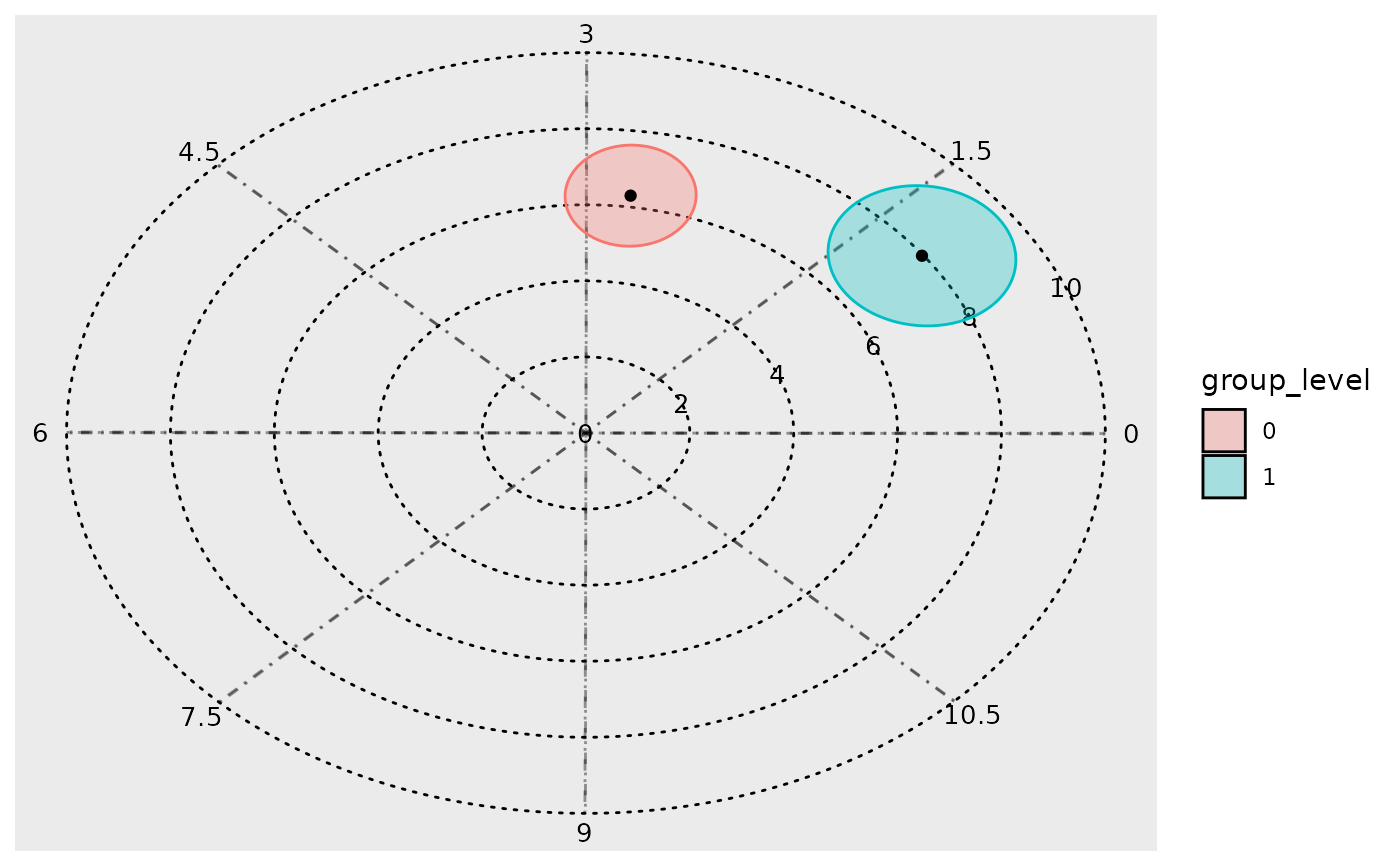
Generates the point estimates and confidence ellipses. If you wish to add multiple estimates and ellipses on the same plot, run this function with the appropriate inputs, with 'plot_background' being set to the plot you wish to layer upon.
Usage
get_point_estimate_plot(
  est_rrr,
  est_sss,
  a_trans,
  b_trans,
  offset,
  direction,
  est_acr,
  group_level,
  group_level_colour_index,
  group_check,
  ellipse_opacity,
  plot_background
)
Arguments
- est_rrr
The rrr estimate.
- est_sss
The sss estimate.
- a_trans
Ellipse long dimension.
- b_trans
Ellipse short dimension.
- offset
Determines where angle starts.
- direction
-1 for clockwise, 1 for anti.
- est_acr
Acrophase estimate.
- group_level
A vector of group levels.
- group_level_colour_index
index for colours.
- group_check
Whether or not group is used in amp_acro().
- ellipse_opacity
0 to 1, alpha value.
- plot_background
The plot to layer upon.
Examples
plot_bground <- GLMMcosinor:::get_background_grid(
  n_breaks = 5,
  max_plot_radius = 10,
  circle_linetype = "dotted",
  dial_pos_full_x = c(10, 7.07, 0.01, -7.09, -10, -7.05, -0.02, 7.09, 10),
  dial_pos_full_y = c(0, 7.07, 10, 7.04, 0.015, -7.09, -10, -7.06, -0.03),
  time_labels = c(0, 1.5, 3, 4.5, 6, 7.5, 9, 10.5, 12),
  text_size = 3.5,
  text_opacity = 1,
  contour_labels = c(0, 2, 4, 6, 8, 10),
  grid_angle_segments = 8
)

GLMMcosinor:::get_point_estimate_plot(
  est_rrr = c(0.86, 6.47),
  est_sss = c(6.24, 4.66),
  a_trans = c(1.33, 1.77),
  b_trans = c(1.26, 1.88),
  offset = 0,
  direction = 1,
  est_acr = c(1.43, 0.62),
  group_level = structure(c("0", "1"), dim = 2L),
  group_level_colour_index = 2L,
  group_check = TRUE,
  ellipse_opacity = 0.3,
  plot_background = plot_bground
)