Plotting summary figures for occCite search results
Source:R/occCite_plotting.R
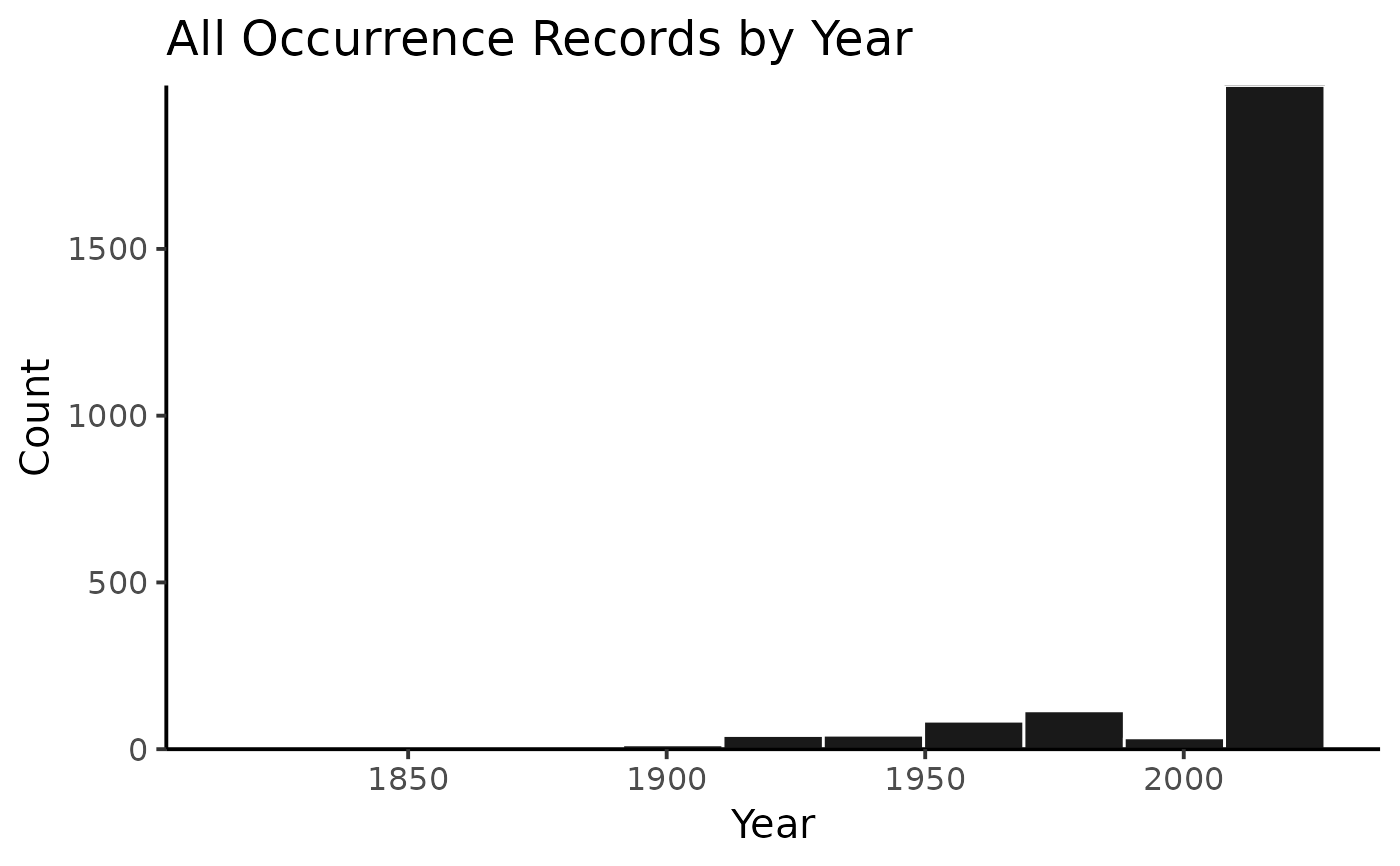
plot.occCiteData.RdGenerates up to three different kinds of plots, with toggles determining whether plots should be done for individual species or aggregating all species–histogram by year of occurrence records, waffle plot of primary data sources, waffle plot of data aggregators.
Usage
# S3 method for class 'occCiteData'
plot(x, ...)
Arguments
- x
An object of class
occCiteDatato map.- ...
Additional arguments affecting how the formatted citation document is produced. `bySpecies`: Logical; setting to `TRUE` generates the desired plots for each species. `plotTypes`: The type of plot to be generated; "yearHistogram", "source", and/or "aggregator".