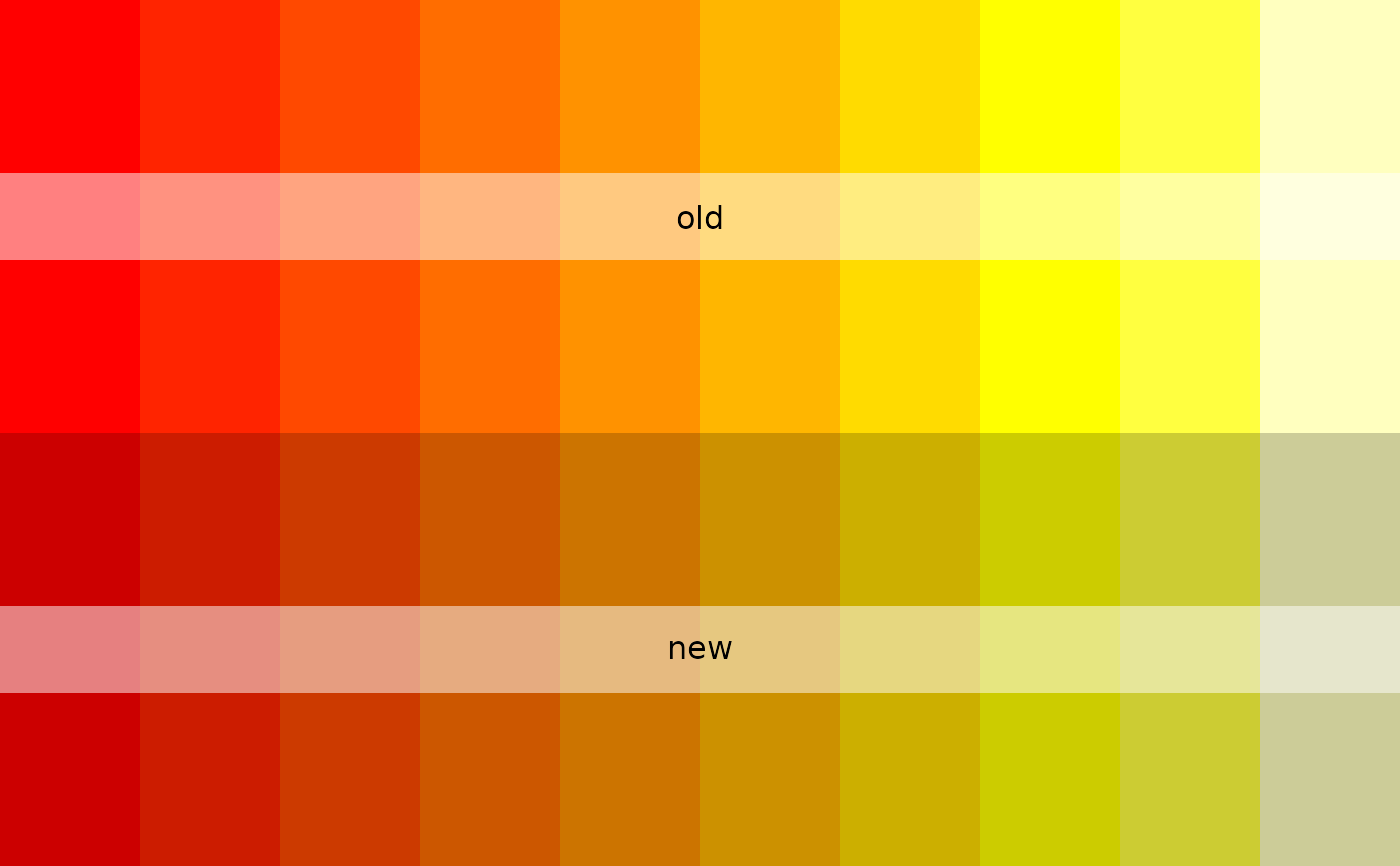
Adjusts a given colour by lightening or darkening it by the specified amount
(relative scale of -1 to 1). Adjustments are made in RGB space, for
limitations of which see ?convertColor
Arguments
- cols
A vector of
Rcolours (for allowable formats of which, see?col2rgb).- adj
A number between -1 and 1 determining how much to lighten (positive values) or darken (negative values) the colours.
- plot
If
TRUE, generates a plot to allow visual comparison of original and adjusted colours.
See also
Other colours:
colour_mat()
Examples
cols <- adjust_colours (cols = heat.colors (10), adj = -0.2, plot = TRUE)


# 'adjust_colours' also offers an easy way to adjust the default colour
# schemes provided by 'osm_structures'. The following lines darken the
# highway colour of the 'light' colour scheme by 20%
structures <- osm_structures (
    structures = c ("building", "highway", "park"),
    col_scheme = "light"
)
structures$cols [2] <- adjust_colours (structures$cols [2], adj = -0.2)
# Plot these structures:
bbox <- get_bbox (c (-0.13, 51.5, -0.11, 51.52))
if (FALSE) { # \dontrun{
dat_B <- extract_osm_objects (key = "building", bbox = bbox)
dat_H <- extract_osm_objects (key = "highway", bbox = bbox)
dat_P <- extract_osm_objects (key = "park", bbox = bbox)
} # }
# These data are also included in the 'london' data of 'osmplotr'
osm_data <- list (
    dat_B = london$dat_BNR,
    dat_H = london$dat_HP,
    dat_P = london$dat_P
)
dat <- make_osm_map (
    structures = structures,
    osm_data = osm_data,
    bbox = bbox
)
print_osm_map (dat$map)
# 'adjust_colours' also offers an easy way to adjust the default colour
# schemes provided by 'osm_structures'. The following lines darken the
# highway colour of the 'light' colour scheme by 20%
structures <- osm_structures (
structures = c ("building", "highway", "park"),
col_scheme = "light"
)
structures$cols [2] <- adjust_colours (structures$cols [2], adj = -0.2)
# Plot these structures:
bbox <- get_bbox (c (-0.13, 51.5, -0.11, 51.52))
if (FALSE) { # \dontrun{
dat_B <- extract_osm_objects (key = "building", bbox = bbox)
dat_H <- extract_osm_objects (key = "highway", bbox = bbox)
dat_P <- extract_osm_objects (key = "park", bbox = bbox)
} # }
# These data are also included in the 'london' data of 'osmplotr'
osm_data <- list (
dat_B = london$dat_BNR,
dat_H = london$dat_HP,
dat_P = london$dat_P
)
dat <- make_osm_map (
structures = structures,
osm_data = osm_data,
bbox = bbox
)
print_osm_map (dat$map)