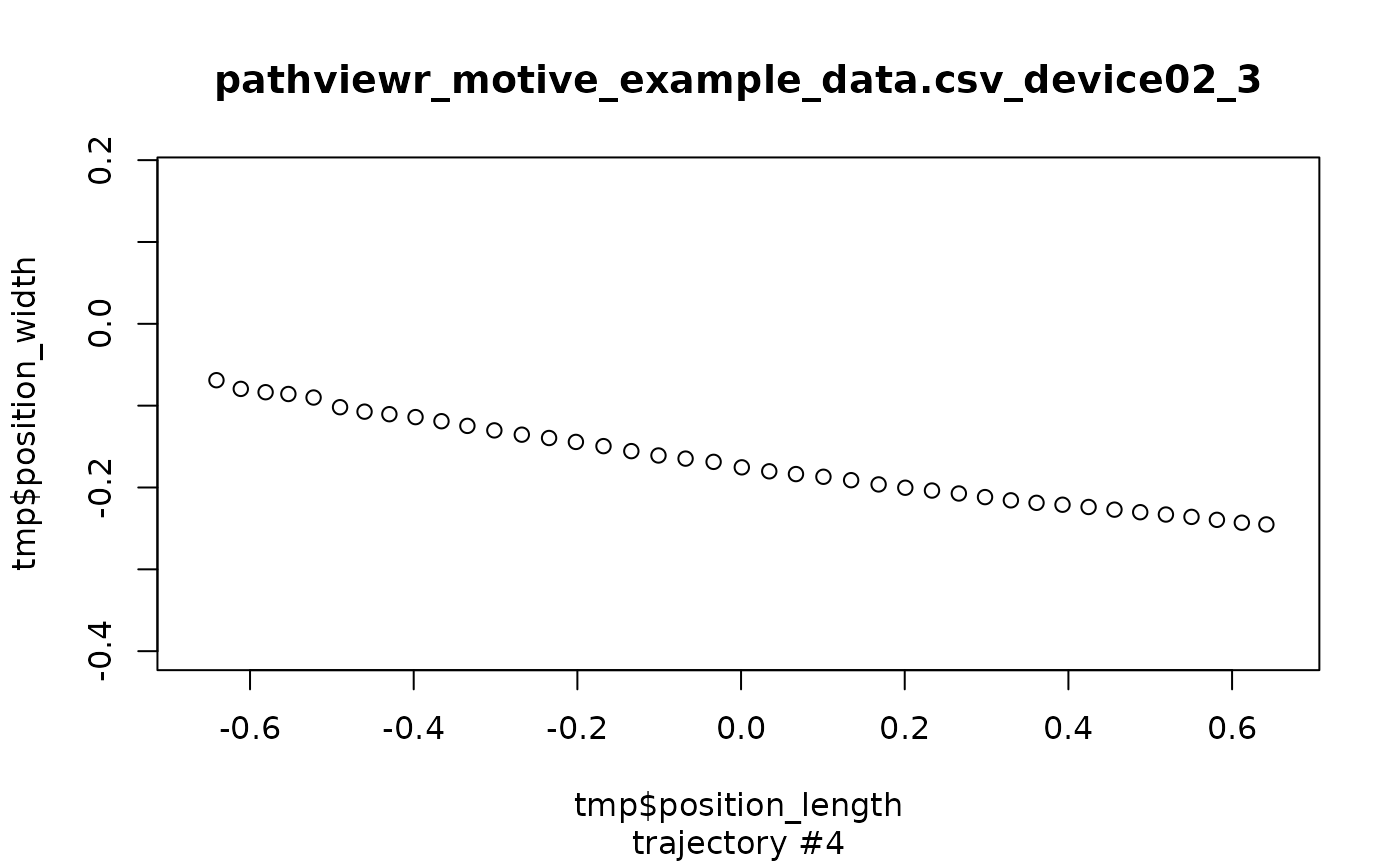
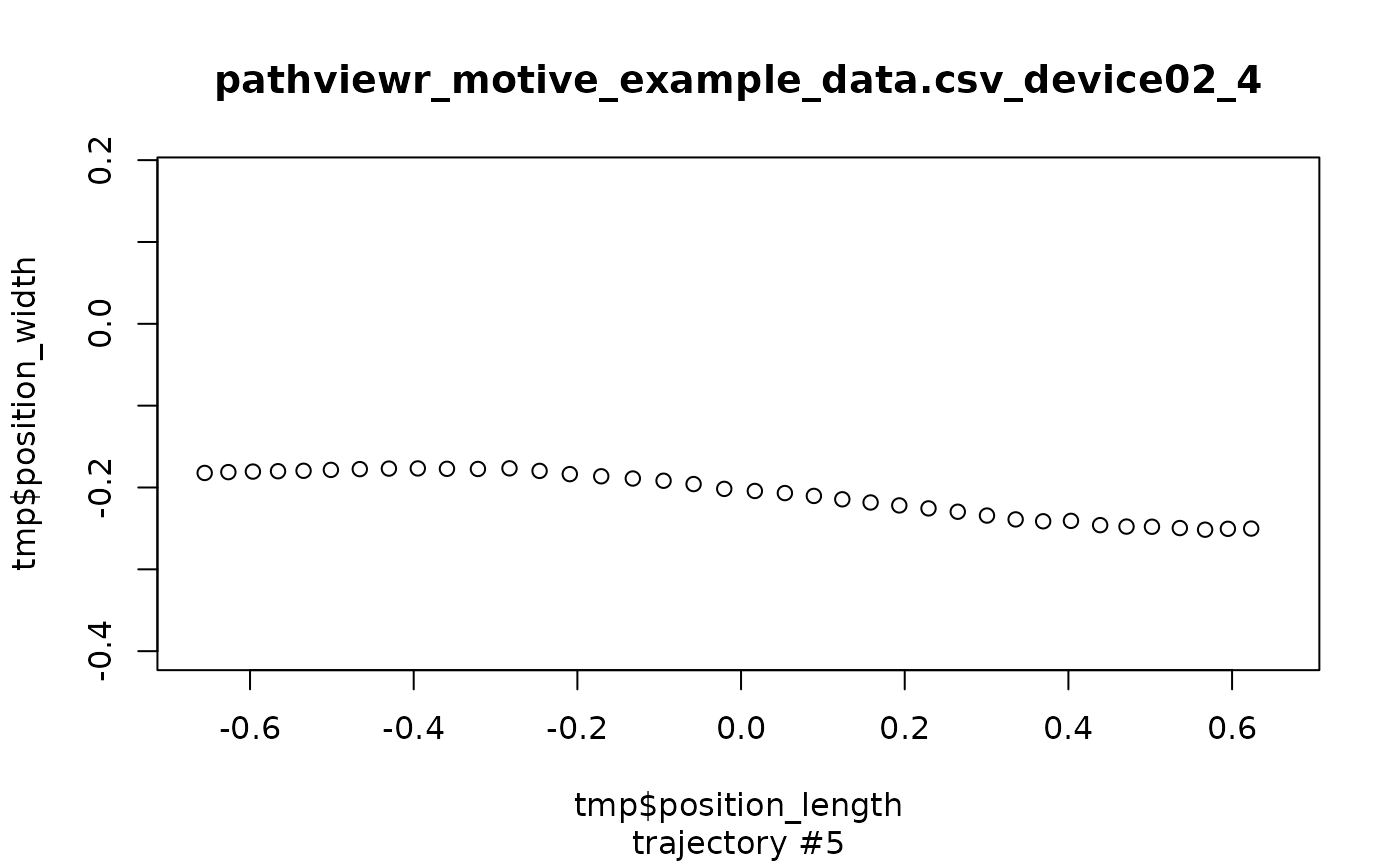
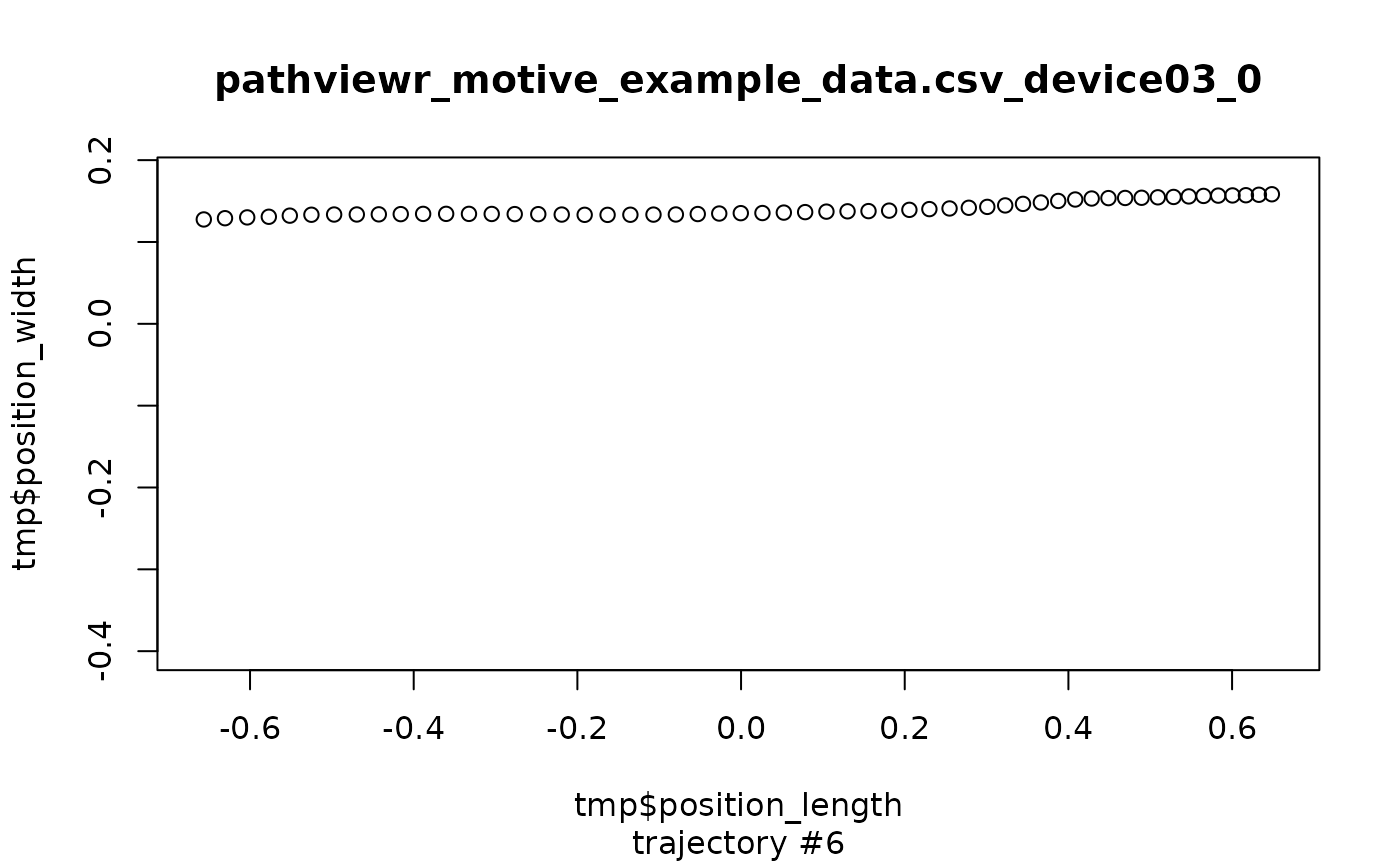
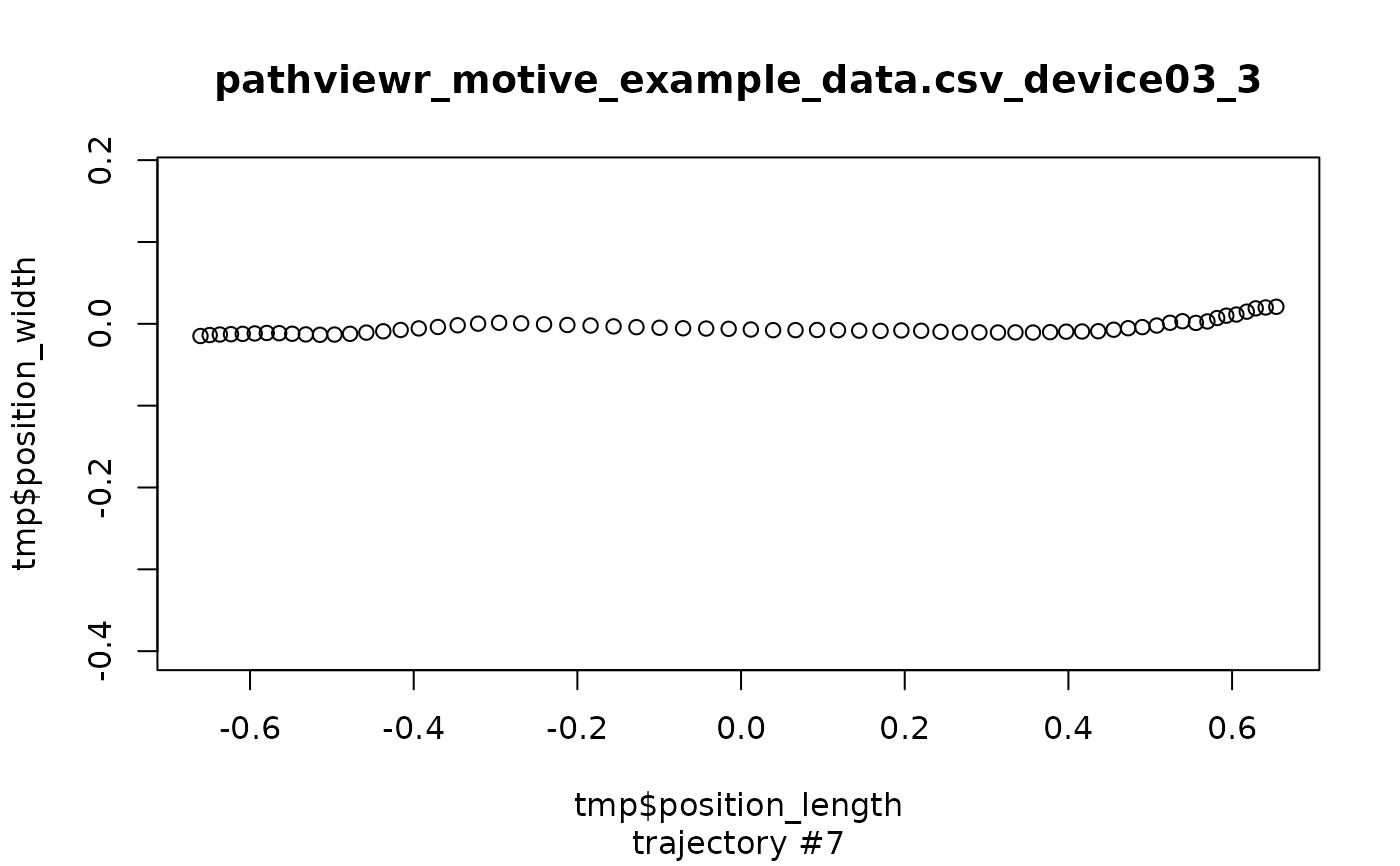
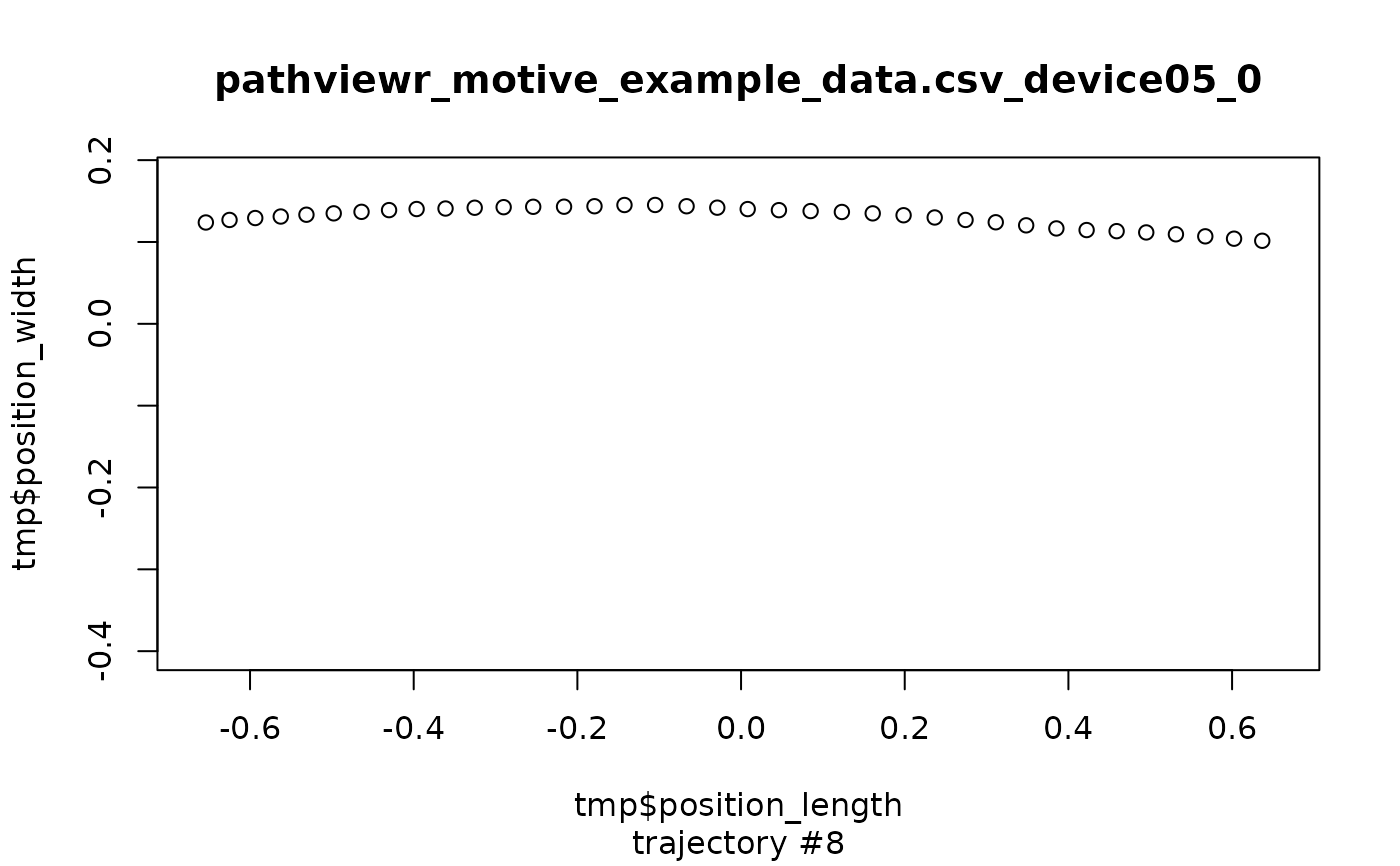
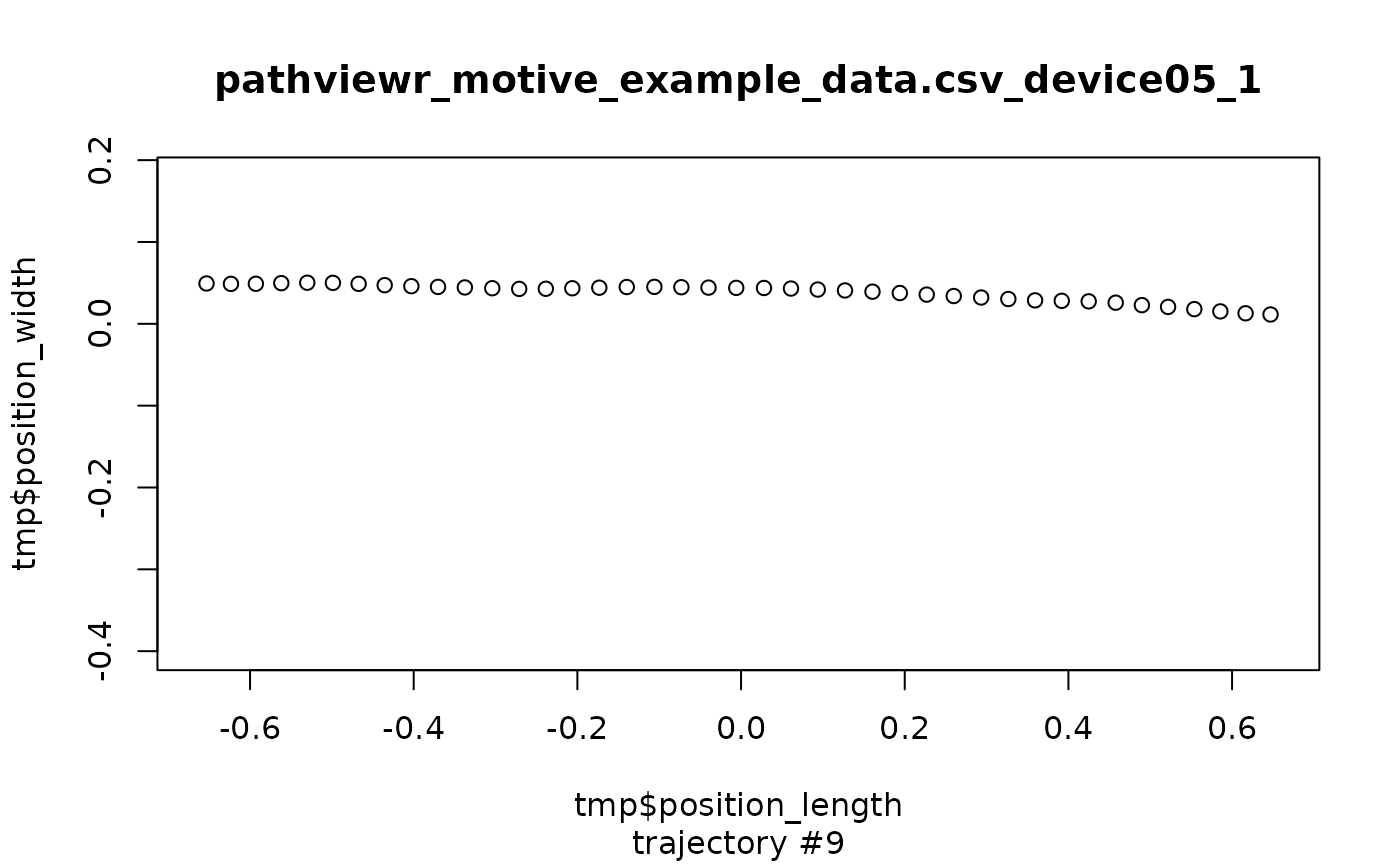
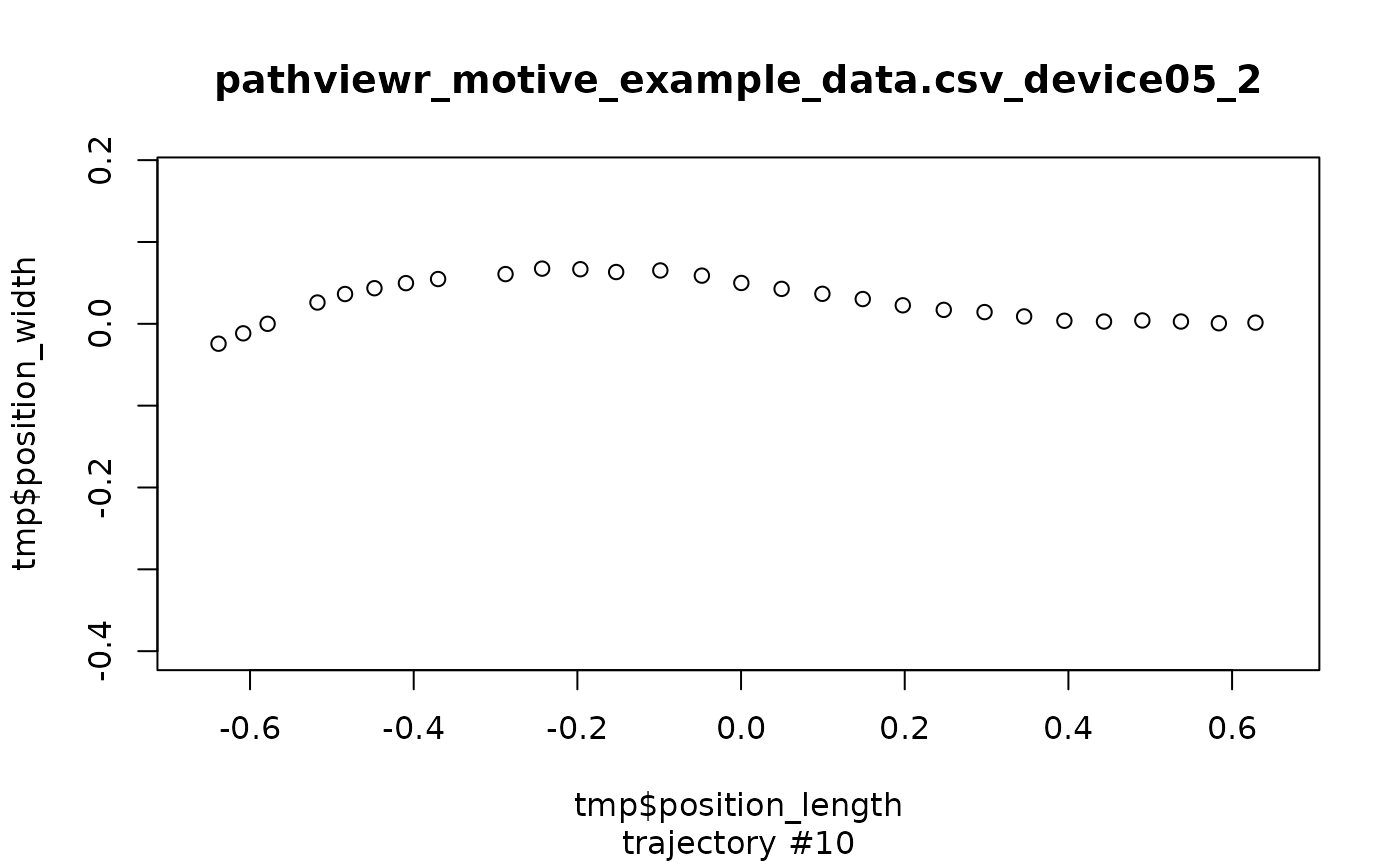
Plot each trajectory within a viewr object
Source:R/plotting_functions.R
plot_viewr_trajectories.RdPlot each trajectory within a viewr object
Usage
plot_viewr_trajectories(
  obj_name,
  plot_axes = c("length", "width"),
  multi_plot = FALSE
)
Arguments
- obj_name
A viewr object (a tibble or data.frame with attribute
pathviewr_stepsthat includes"viewr") that has been passed throughseparate_trajectories()orget_full_trajectories().- plot_axes
Which position axes should be plotted? A character vector including exactly two of the following choices must be supplied:
length,width,height. Default is c("length", "width").- multi_plot
Should separate plots (one per trajectory) be created or should one multi-plot grid be generated. Defaults to FALSE, which produces separate plots.
Value
A (base-R) series of plots or single plot (if multi_plot =
TRUE) that depict each trajectory along the chosen axes.
See also
Other plotting functions:
plot_by_subject(),
visualize_frame_gap_choice()
Examples
library(pathviewr)
## Import the example Motive data included in the package
motive_data <-
read_motive_csv(system.file("extdata", "pathviewr_motive_example_data.csv",
package = 'pathviewr'))
motive_full <-
motive_data %>%
clean_viewr(desired_percent = 50,
max_frame_gap = "autodetect",
span = 0.95)
#> autodetect is an experimental feature -- please report issues.
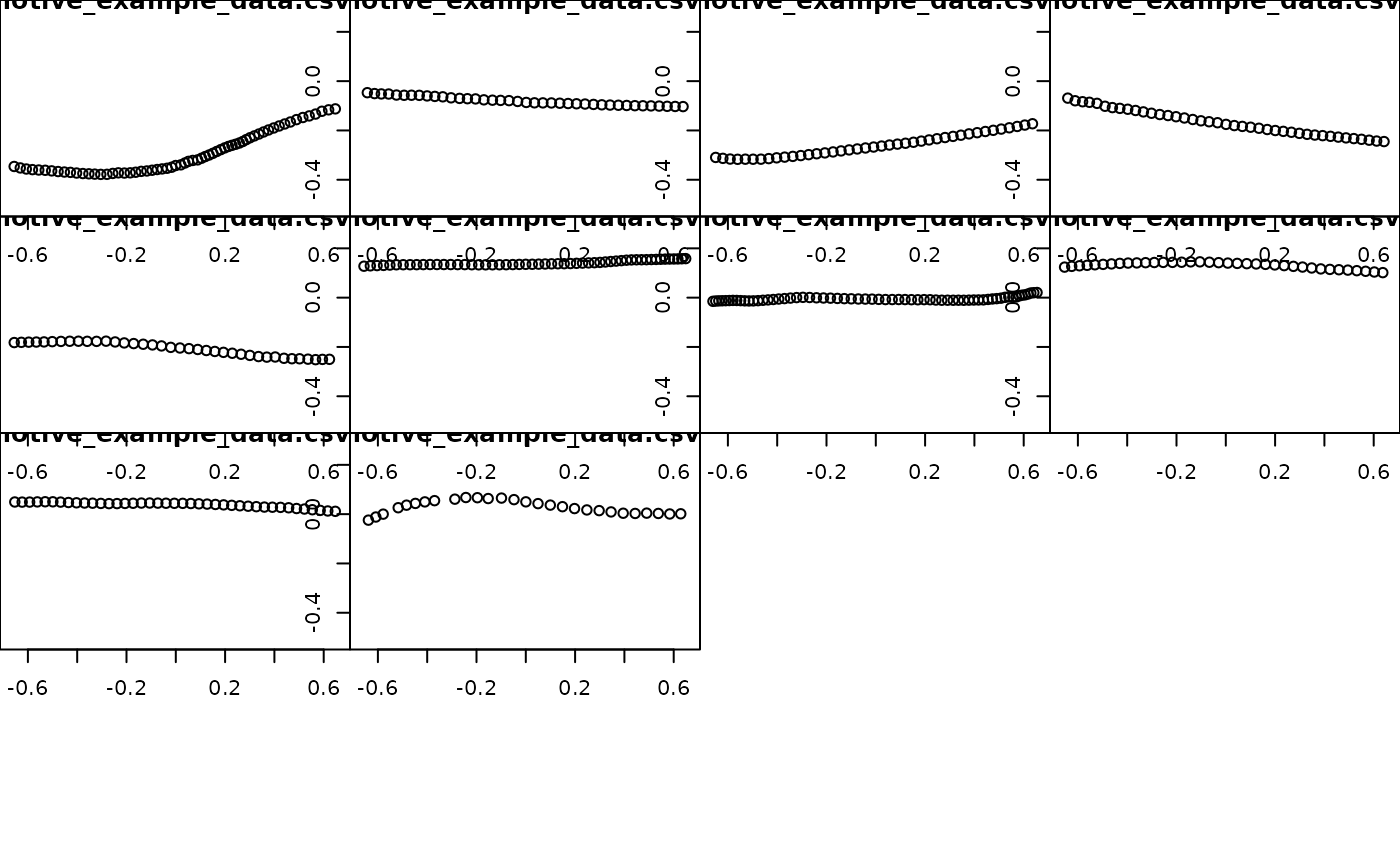
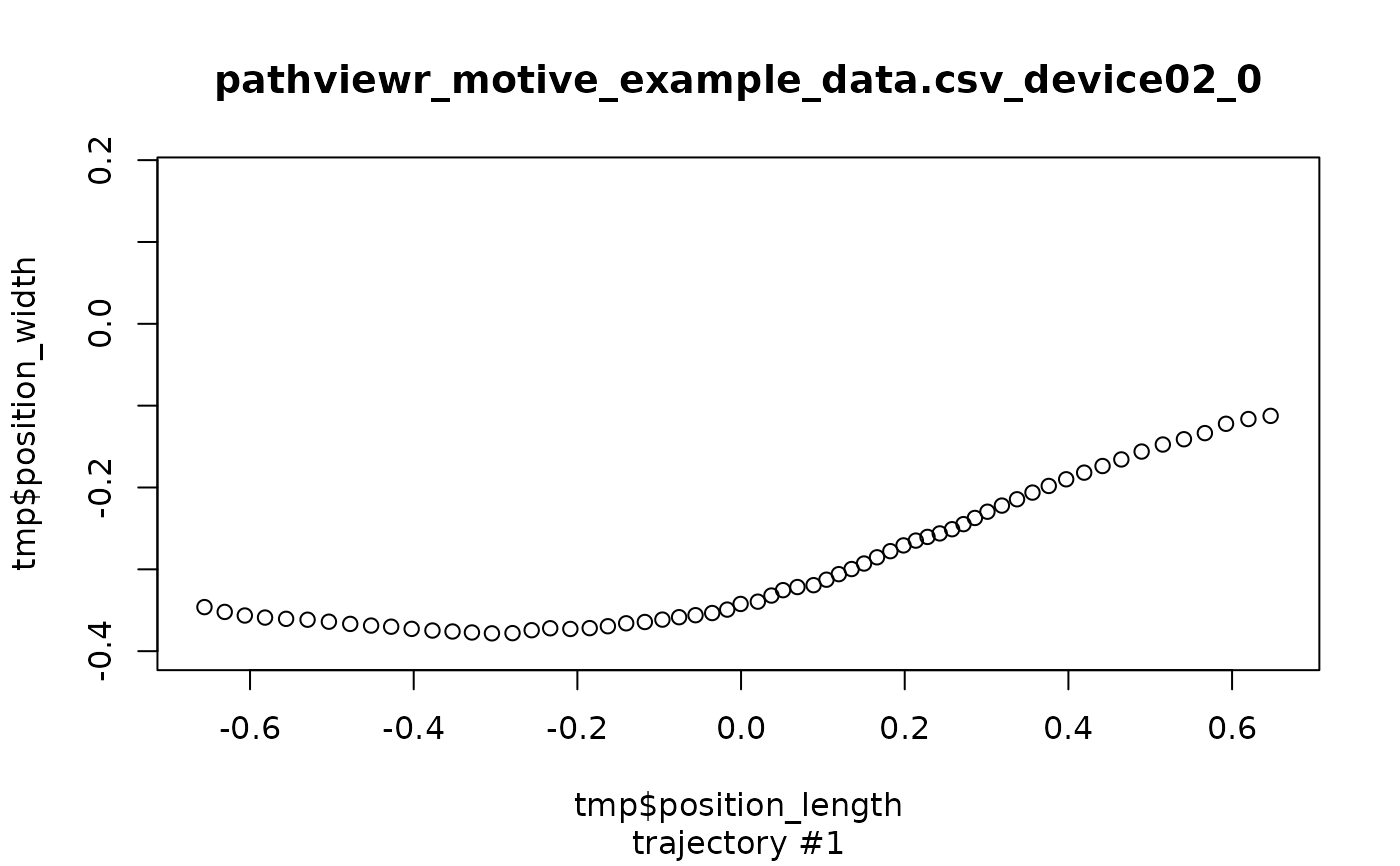
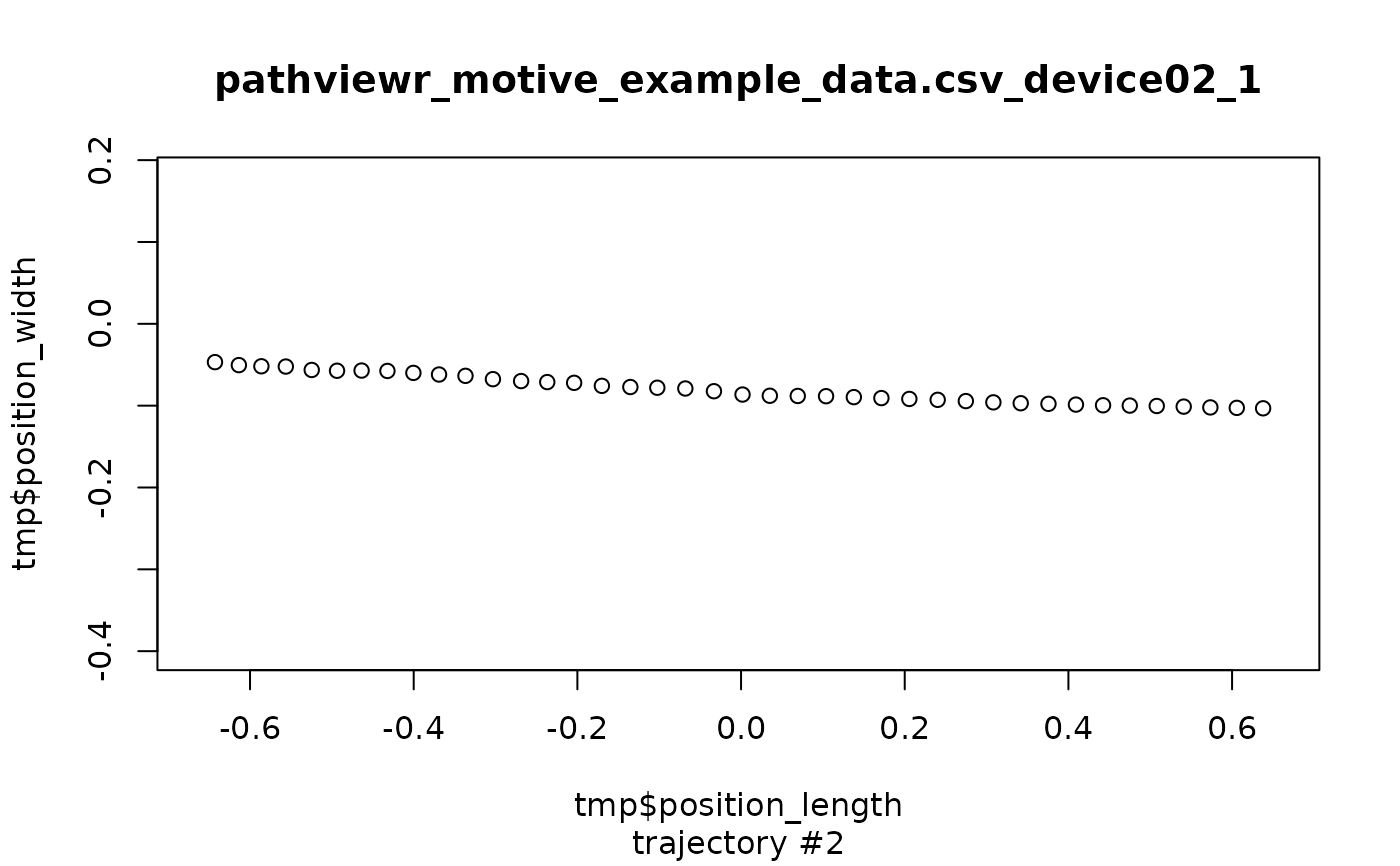
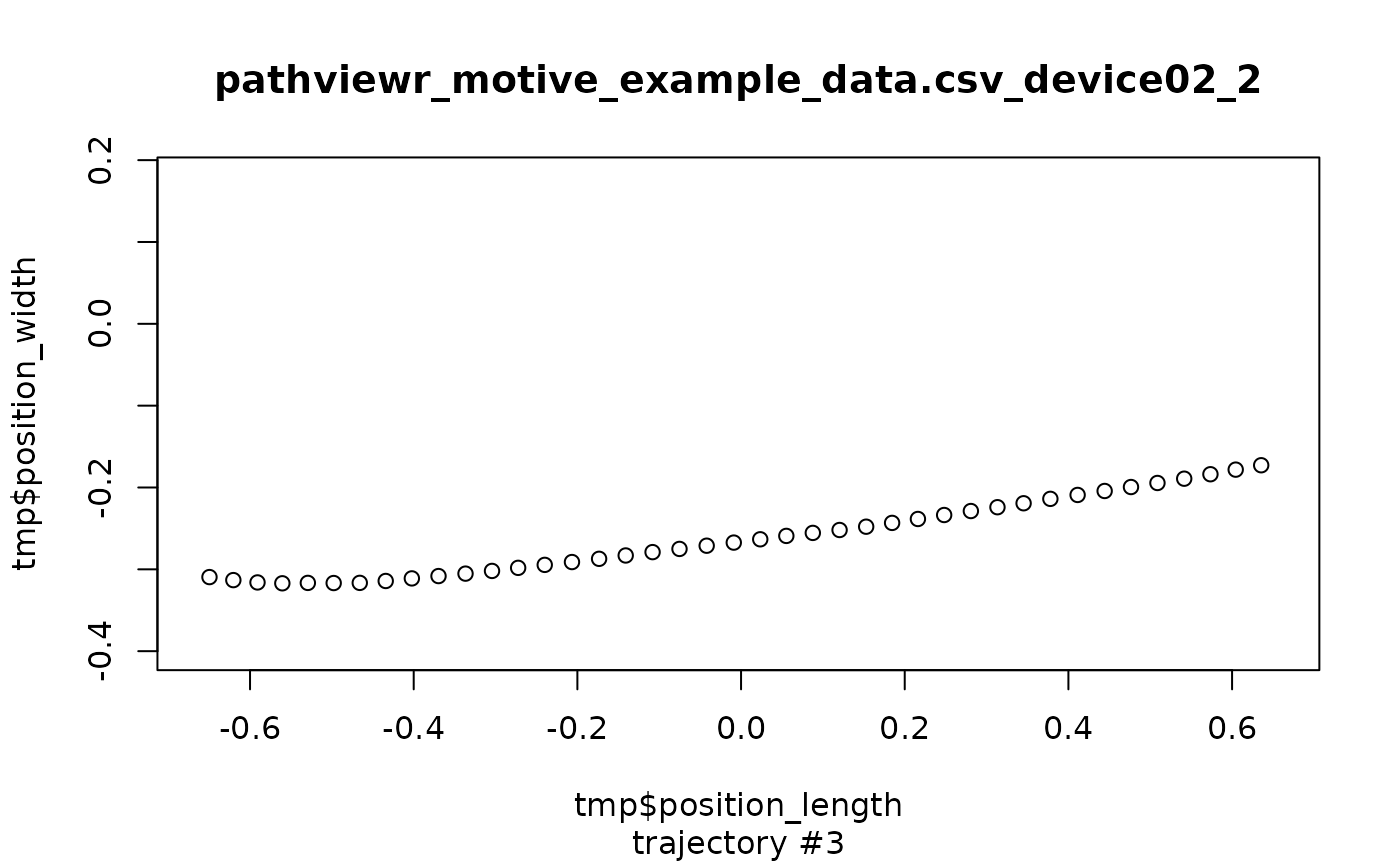
plot_viewr_trajectories(motive_full, multi_plot = FALSE)
 plot_viewr_trajectories(motive_full, multi_plot = TRUE)