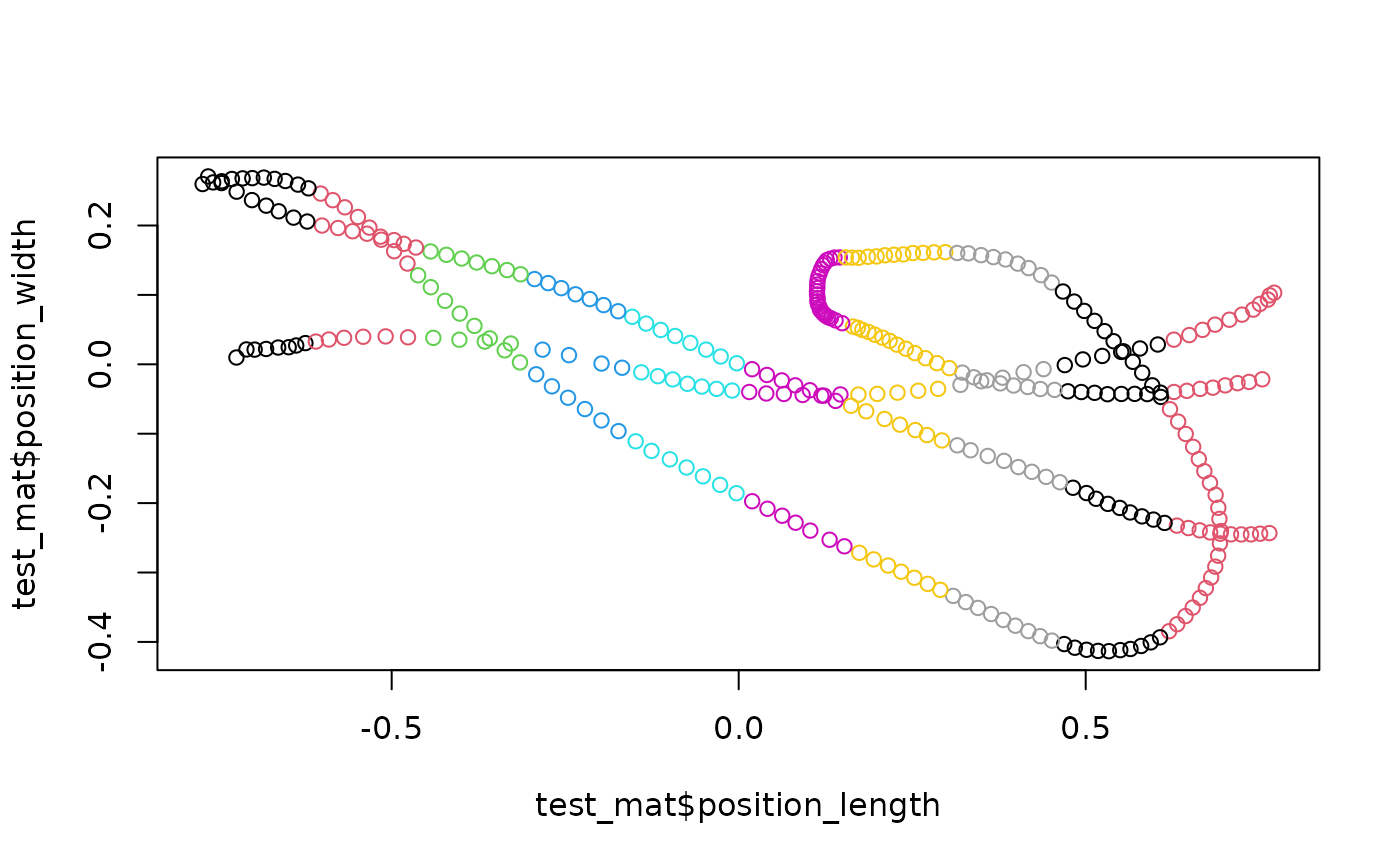
Chop data into X sections (of equal size) along a specified axis
Value
A new column added to the input data object called section_id,
which is an ordered factor that indicates grouping.
Examples
## Load data and run section_tunnel_by()
test_mat <-
  read_flydra_mat(system.file("extdata", "pathviewr_flydra_example_data.mat",
                             package = 'pathviewr'),
                  subject_name = "birdie_wooster") %>%
  redefine_tunnel_center(length_method = "middle",
                         height_method = "user-defined",
                         height_zero = 1.44) %>%
  select_x_percent(desired_percent = 50) %>%
  separate_trajectories(max_frame_gap = 1) %>%
  get_full_trajectories(span = 0.95) %>%
  section_tunnel_by(number_of_sections = 10)

## Plot; color by section ID
plot(test_mat$position_length,
     test_mat$position_width,
     asp = 1, col = as.factor(test_mat$section_id))

