Plot addresses, the number of which are summed by country_name
Source:R/plot_addresses_country.R
plot_addresses_country.RdThis function plots an addresses data.frame object by country name.
Arguments
- data
address element from the output from the
authors_georef()function, containing geocoded address latitude and longitude locations.- mapRegion
what portion of the world map to show. possible values include
"world","North America","South America","Australia","Africa","Antarctica", and"Eurasia"
Examples
## Using the output of authors_georef (e.g., BITR_geocode)
data(BITR_geocode)
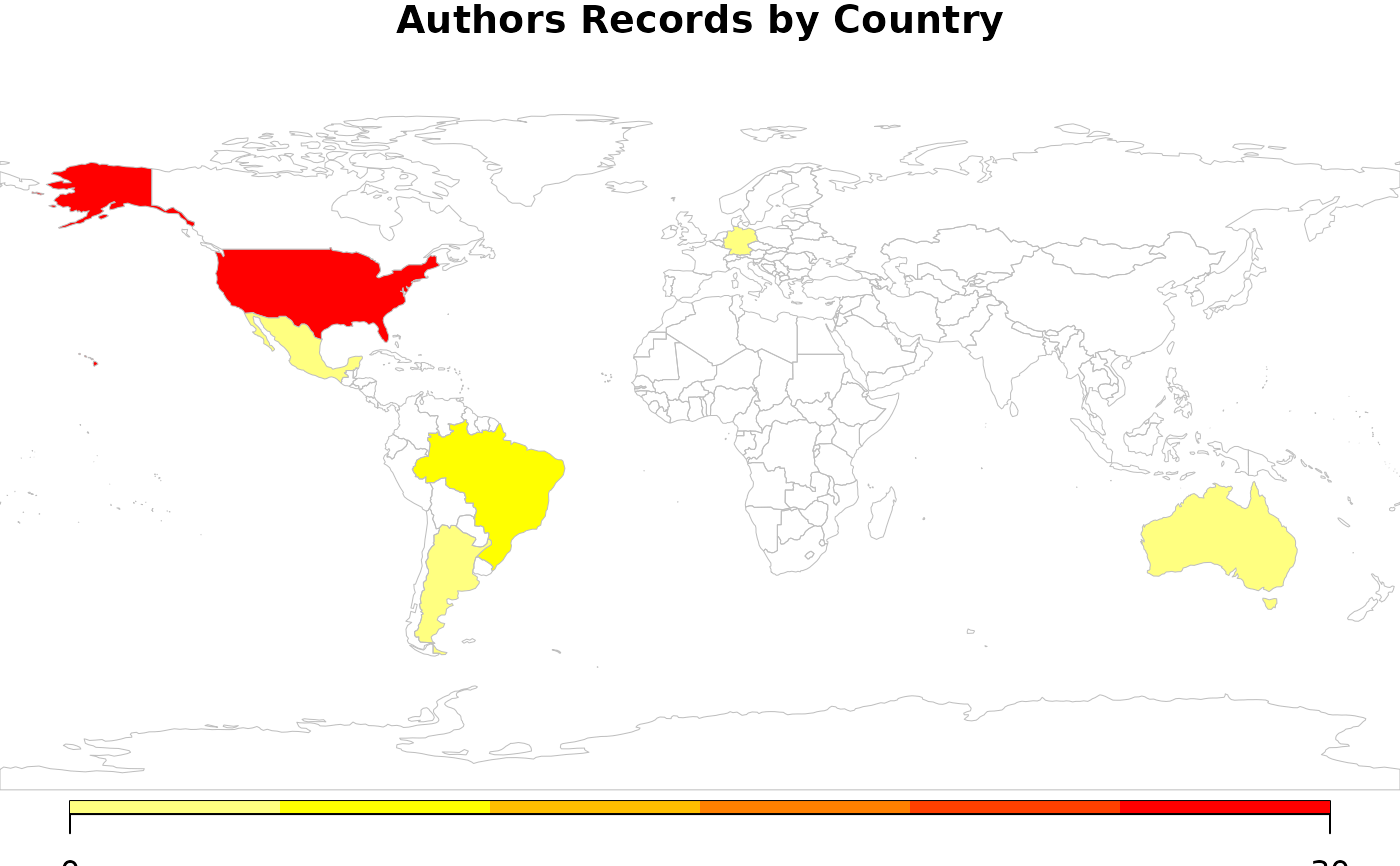
## Plots the whole world
plot_addresses_country(BITR_geocode)
#> 6 codes from your data successfully matched countries in the map
#> 0 codes from your data failed to match with a country code in the map
#> failedCodes failedCountries
#> 237 codes from the map weren't represented in your data
#> You asked for 7 categories, 6 were used due to pretty() classification
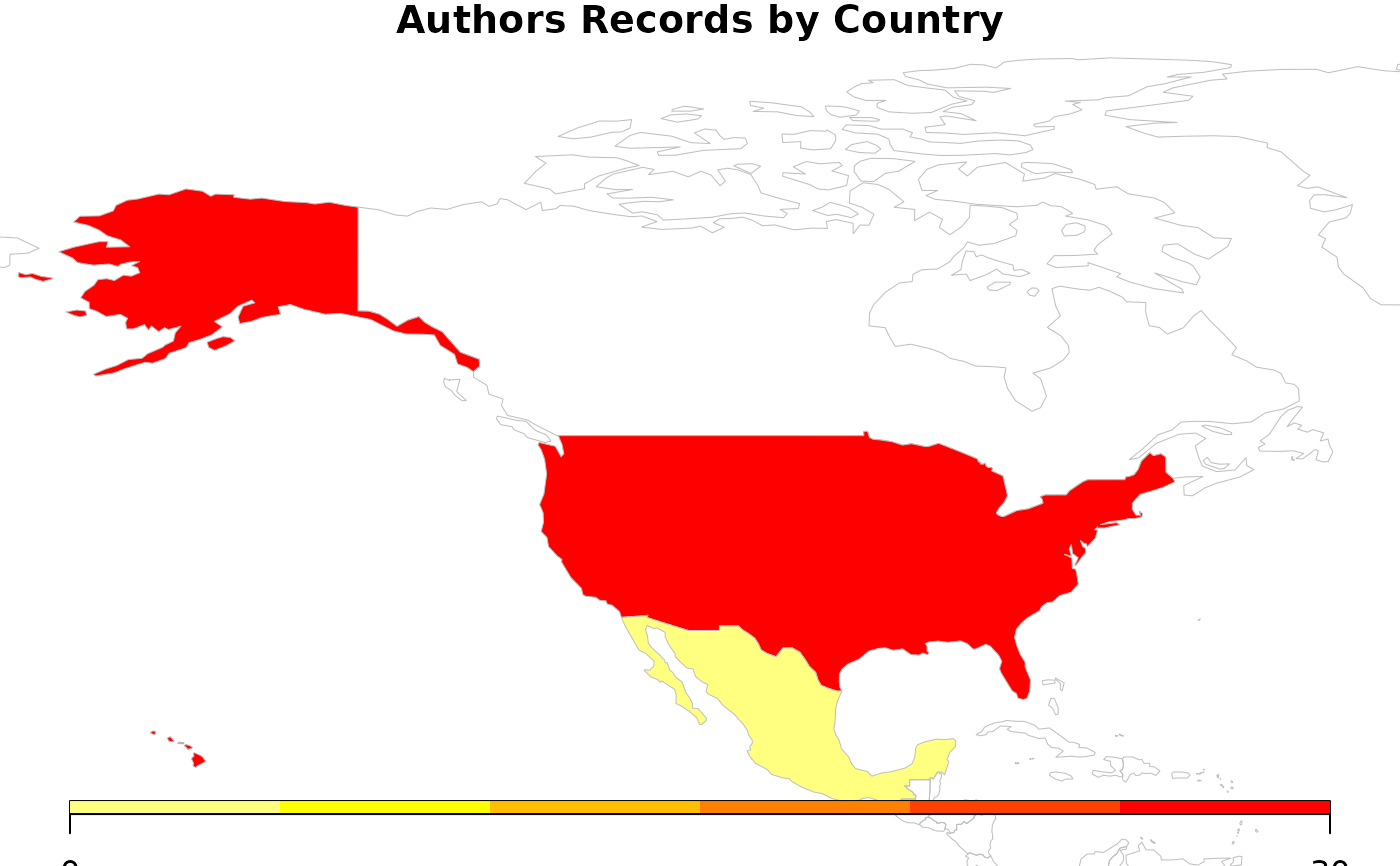
 ## Just select North America
plot_addresses_country(BITR_geocode, mapRegion = 'North America')
#> 6 codes from your data successfully matched countries in the map
#> 0 codes from your data failed to match with a country code in the map
#> failedCodes failedCountries
#> 237 codes from the map weren't represented in your data
#> You asked for 7 categories, 6 were used due to pretty() classification
## Just select North America
plot_addresses_country(BITR_geocode, mapRegion = 'North America')
#> 6 codes from your data successfully matched countries in the map
#> 0 codes from your data failed to match with a country code in the map
#> failedCodes failedCountries
#> 237 codes from the map weren't represented in your data
#> You asked for 7 categories, 6 were used due to pretty() classification