NCDC introduction
Scott Chamberlain
2020-08-14
Source:vignettes/ncdc_vignette.Rmd
ncdc_vignette.Rmdrnoaa is an R wrapper for many NOAA data types,
including National Climatic Data Center (NCDC).
Get info on a station by specifying a datasetid, locationid, and stationid
ncdc_stations(datasetid='GHCND', locationid='FIPS:12017', stationid='GHCND:USC00084289')
#> $meta
#> NULL
#>
#> $data
#>   elevation    mindate    maxdate latitude                  name datacoverage
#> 1      17.7 1899-01-01 2020-08-12 28.80286 INVERNESS 3 SE, FL US            1
#>                  id elevationUnit longitude
#> 1 GHCND:USC00084289        METERS -82.31266
#>
#> attr(,"class")
#> [1] "ncdc_stations"
Search for data and get a data.frame
out <- ncdc(datasetid='NORMAL_DLY', datatypeid='dly-tmax-normal', startdate = '2010-05-01', enddate = '2010-05-10')
out$data
#> # A tibble: 25 x 5
#>    date                datatype        station           value fl_c
#>    <chr>               <chr>           <chr>             <int> <chr>
#>  1 2010-05-01T00:00:00 DLY-TMAX-NORMAL GHCND:AQW00061705   869 C
#>  2 2010-05-01T00:00:00 DLY-TMAX-NORMAL GHCND:CAW00064757   607 Q
#>  3 2010-05-01T00:00:00 DLY-TMAX-NORMAL GHCND:CQC00914080   840 R
#>  4 2010-05-01T00:00:00 DLY-TMAX-NORMAL GHCND:CQC00914801   858 R
#>  5 2010-05-01T00:00:00 DLY-TMAX-NORMAL GHCND:FMC00914395   876 P
#>  6 2010-05-01T00:00:00 DLY-TMAX-NORMAL GHCND:FMC00914419   885 P
#>  7 2010-05-01T00:00:00 DLY-TMAX-NORMAL GHCND:FMC00914446   885 P
#>  8 2010-05-01T00:00:00 DLY-TMAX-NORMAL GHCND:FMC00914482   868 R
#>  9 2010-05-01T00:00:00 DLY-TMAX-NORMAL GHCND:FMC00914720   899 R
#> 10 2010-05-01T00:00:00 DLY-TMAX-NORMAL GHCND:FMC00914761   897 P
#> # … with 15 more rows
Note that the value column has strangely large numbers
for temperature measurements. By convention, rnoaa doesn’t
do any conversion of values from the APIs and some APIs use seemingly
odd units.
You have two options here:
Use the
add_unitsparameter onncdc()to havernoaaattempt to look up the units. This is a good idea to try first.Consult the documentation for whiechever dataset you’re accessing. In this case,
GHCNDhas a README (https://www1.ncdc.noaa.gov/pub/data/ghcn/daily/readme.txt) which indicatesTMAXis measured in tenths of degrees Celcius.
See a data.frame with units
As mentioned above, you can use the add_units parameter
with ncdc() to ask rnoaa to attempt to look up
units for whatever data you ask it to return. Let’s ask
rnoaa to add units to some precipitation (PRCP) data:
with_units <- ncdc(datasetid='GHCND', stationid='GHCND:USW00014895', datatypeid='PRCP', startdate = '2010-05-01', enddate = '2010-10-31', limit=500, add_units = TRUE)
head( with_units$data )
#> # A tibble: 6 x 9
#>   date            datatype station         value fl_m  fl_q  fl_so fl_t  units
#>   <chr>           <chr>    <chr>           <int> <chr> <chr> <chr> <chr> <chr>
#> 1 2010-05-01T00:… PRCP     GHCND:USW00014…     0 "T"   ""    0     2400  mm_ten…
#> 2 2010-05-02T00:… PRCP     GHCND:USW00014…    30 ""    ""    0     2400  mm_ten…
#> 3 2010-05-03T00:… PRCP     GHCND:USW00014…    51 ""    ""    0     2400  mm_ten…
#> 4 2010-05-04T00:… PRCP     GHCND:USW00014…     0 "T"   ""    0     2400  mm_ten…
#> 5 2010-05-05T00:… PRCP     GHCND:USW00014…    18 ""    ""    0     2400  mm_ten…
#> 6 2010-05-06T00:… PRCP     GHCND:USW00014…    30 ""    ""    0     2400  mm_ten…
From the above output, we can see that the units for
PRCP values are “mm_tenths” which means tenths of a
millimeter. You won’t always be so lucky and sometimes you will have to
look up the documentation on your own.
Plot data, super simple, but it’s a start
out <- ncdc(datasetid='NORMAL_DLY', stationid='GHCND:USW00014895', datatypeid='dly-tmax-normal', startdate = '2010-01-01', enddate = '2010-12-10', limit = 300)
ncdc_plot(out)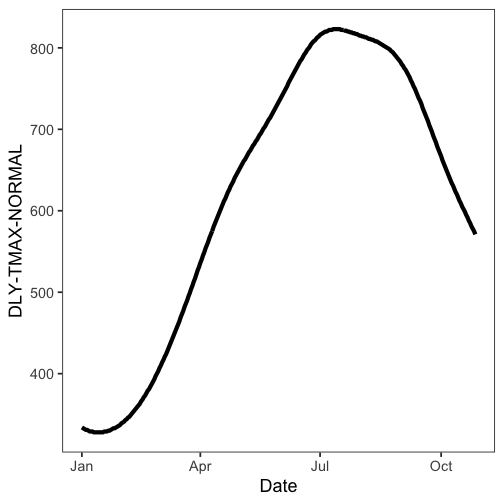
Note that PRCP values are in units of tenths of a
millimeter, as we found out above.
More on plotting
Example 1
Search for data first, then plot
out <- ncdc(datasetid='GHCND', stationid='GHCND:USW00014895', datatypeid='PRCP', startdate = '2010-05-01', enddate = '2010-10-31', limit=500)Default plot
ncdc_plot(out)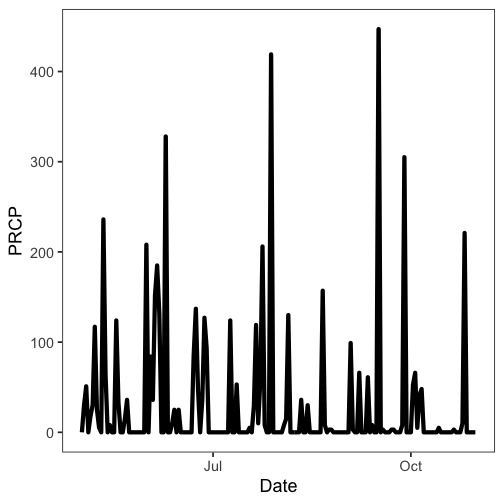
Create 14 day breaks
ncdc_plot(out, breaks="14 days")
One month breaks
ncdc_plot(out, breaks="1 month", dateformat="%d/%m")
Example 2
Search for data
out <- ncdc(datasetid='GHCND', stationid='GHCND:USW00014895', datatypeid='PRCP',
startdate = '2010-05-01', enddate = '2010-10-31', limit=500)Make a plot, with 6 hour breaks, and date format with only hour
ncdc_plot(out, breaks = "1 month", dateformat = "%d/%m")
Combine many calls to noaa function
Search for two sets of data
out1 <- ncdc(datasetid='GHCND', stationid='GHCND:USW00014895', datatypeid='PRCP', startdate = '2010-03-01', enddate = '2010-05-31', limit=500)

out2 <- ncdc(datasetid='GHCND', stationid='GHCND:USW00014895', datatypeid='PRCP', startdate = '2010-09-01', enddate = '2010-10-31', limit=500)
Then combine with a call to ncdc_combine
df <- ncdc_combine(out1, out2)
head(df[[1]]); tail(df[[1]])
#> # A tibble: 6 x 8
#>   date                datatype station           value fl_m  fl_q  fl_so fl_t
#>   <chr>               <chr>    <chr>             <int> <chr> <chr> <chr> <chr>
#> 1 2010-03-01T00:00:00 PRCP     GHCND:USW00014895     0 "T"   ""    0     2400
#> 2 2010-03-02T00:00:00 PRCP     GHCND:USW00014895     0 "T"   ""    0     2400
#> 3 2010-03-03T00:00:00 PRCP     GHCND:USW00014895     0 "T"   ""    0     2400
#> 4 2010-03-04T00:00:00 PRCP     GHCND:USW00014895     0 ""    ""    0     2400
#> 5 2010-03-05T00:00:00 PRCP     GHCND:USW00014895     0 ""    ""    0     2400
#> 6 2010-03-06T00:00:00 PRCP     GHCND:USW00014895     0 ""    ""    0     2400
#> # A tibble: 6 x 8
#>   date                datatype station           value fl_m  fl_q  fl_so fl_t
#>   <chr>               <chr>    <chr>             <int> <chr> <chr> <chr> <chr>
#> 1 2010-10-26T00:00:00 PRCP     GHCND:USW00014895   221 ""    ""    0     2400
#> 2 2010-10-27T00:00:00 PRCP     GHCND:USW00014895     0 ""    ""    0     2400
#> 3 2010-10-28T00:00:00 PRCP     GHCND:USW00014895     0 "T"   ""    0     2400
#> 4 2010-10-29T00:00:00 PRCP     GHCND:USW00014895     0 "T"   ""    0     2400
#> 5 2010-10-30T00:00:00 PRCP     GHCND:USW00014895     0 ""    ""    0     2400
#> 6 2010-10-31T00:00:00 PRCP     GHCND:USW00014895     0 ""    ""    0     2400
Then plot - the default passing in the combined plot plots the data together. In this case it looks kind of weird since a straight line combines two distant dates.
ncdc_plot(df)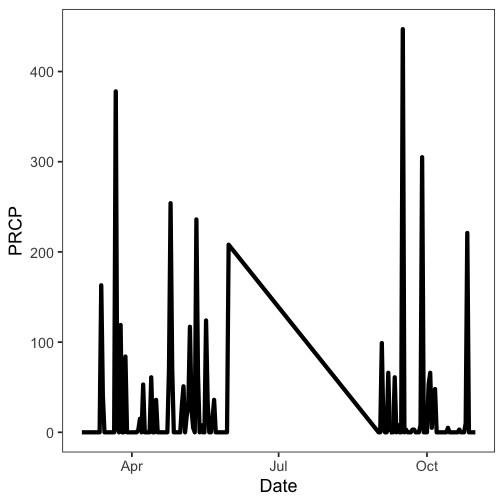
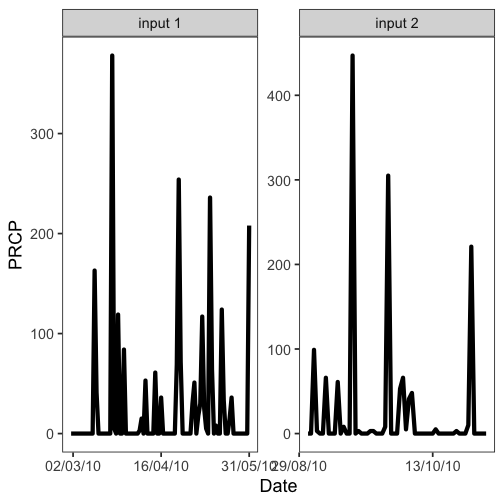
But we can pass in each separately, which uses
facet_wrap in ggplot2 to plot each set of data
in its own panel.
ncdc_plot(out1, out2, breaks="45 days")