For additional vignettes see https://docs.ropensci.org/rnoaa/
Installation
GDAL
You’ll need GDAL (https://gdal.org/) installed first. You may want to use
GDAL >= 0.9-1 since that version or later can read
TopoJSON format files as well, which aren’t required here, but may be
useful. Install GDAL:
- OSX - From https://www.kyngchaos.com/software/frameworks/
- Linux - run
sudo apt-get install gdal-bin - Windows - From https://trac.osgeo.org/osgeo4w/
Then when you install the R package rgdal
(rgeos also requires GDAL), you’ll most likely need to
specify where you’re gdal-config file is on your machine,
as well as a few other things. I have an OSX Mavericks machine, and this
works for me (there’s no binary for Mavericks, so install the source
version):
install.packages("https://cran.r-project.org/src/contrib/rgdal_0.9-1.tar.gz", repos = NULL, type="source", configure.args = "--with-gdal-config=/Library/Frameworks/GDAL.framework/Versions/1.10/unix/bin/gdal-config --with-proj-include=/Library/Frameworks/PROJ.framework/unix/include --with-proj-lib=/Library/Frameworks/PROJ.framework/unix/lib")The rest of the installation should be easy. If not, let us know.
Stable version from CRAN
install.packages("rnoaa")or development version from GitHub
remotes::install_github("ropensci/rnoaa")Load rnoaa
NCDC v2 API data
NCDC Authentication
You’ll need an API key to use the NOAA NCDC functions (those starting
with ncdc*()) in this package (essentially a password). Go
to https://www.ncdc.noaa.gov/cdo-web/token to get one.
You can’t use this package without an API key.
Once you obtain a key, there are two ways to use it.
- Pass it inline with each function call (somewhat cumbersome)
ncdc(datasetid = 'PRECIP_HLY', locationid = 'ZIP:28801', datatypeid = 'HPCP', startdate = '2013-10-01', enddate = '2013-12-01', limit = 5, token = "YOUR_TOKEN")- Alternatively, you might find it easier to set this as an option,
either by adding this line to the top of a script or somewhere in your
.rprofile
options(noaakey = "KEY_EMAILED_TO_YOU")- You can always store in permamently in your
.Rprofilefile.
Fetch list of city locations in descending order
ncdc_locs(locationcategoryid='CITY', sortfield='name', sortorder='desc')
#> $meta
#> $meta$totalCount
#> [1] 1989
#>
#> $meta$pageCount
#> [1] 25
#>
#> $meta$offset
#> [1] 1
#>
#>
#> $data
#>       mindate    maxdate                  name datacoverage            id
#> 1  1892-08-01 2021-05-31            Zwolle, NL       1.0000 CITY:NL000012
#> 2  1901-01-01 2021-11-23            Zurich, SZ       1.0000 CITY:SZ000007
#> 3  1957-07-01 2021-11-23         Zonguldak, TU       1.0000 CITY:TU000057
#> 4  1906-01-01 2021-11-23            Zinder, NG       0.9025 CITY:NG000004
#> 5  1973-01-01 2021-11-23        Ziguinchor, SG       1.0000 CITY:SG000004
#> 6  1938-01-01 2021-11-23         Zhytomyra, UP       0.9723 CITY:UP000025
#> 7  1948-03-01 2021-11-23        Zhezkazgan, KZ       0.9302 CITY:KZ000017
#> 8  1951-01-01 2021-11-23         Zhengzhou, CH       1.0000 CITY:CH000045
#> 9  1941-01-01 2021-11-23          Zaragoza, SP       1.0000 CITY:SP000021
#> 10 1936-01-01 2009-06-17      Zaporiyhzhya, UP       1.0000 CITY:UP000024
#> 11 1957-01-01 2021-11-23          Zanzibar, TZ       0.8016 CITY:TZ000019
#> 12 1973-01-01 2021-11-23            Zanjan, IR       0.9105 CITY:IR000020
#> 13 1893-01-01 2021-11-26     Zanesville, OH US       1.0000 CITY:US390029
#> 14 1912-01-01 2021-11-23             Zahle, LE       0.9819 CITY:LE000004
#> 15 1951-01-01 2021-11-23           Zahedan, IR       0.9975 CITY:IR000019
#> 16 1860-12-01 2021-11-23            Zagreb, HR       1.0000 CITY:HR000002
#> 17 1929-07-01 2021-10-09         Zacatecas, MX       1.0000 CITY:MX000036
#> 18 1947-01-01 2021-11-23 Yuzhno-Sakhalinsk, RS       1.0000 CITY:RS000081
#> 19 1893-01-01 2021-11-26           Yuma, AZ US       1.0000 CITY:US040015
#> 20 1942-02-01 2021-11-25   Yucca Valley, CA US       1.0000 CITY:US060048
#> 21 1885-01-01 2021-11-26      Yuba City, CA US       1.0000 CITY:US060047
#> 22 1998-02-01 2021-11-23            Yozgat, TU       0.9993 CITY:TU000056
#> 23 1893-01-01 2021-11-26     Youngstown, OH US       1.0000 CITY:US390028
#> 24 1894-01-01 2021-11-26           York, PA US       1.0000 CITY:US420024
#> 25 1869-01-01 2021-11-26        Yonkers, NY US       1.0000 CITY:US360031
#>
#> attr(,"class")
#> [1] "ncdc_locs"
Get info on a station by specifying a dataset, locationtype, location, and station
ncdc_stations(datasetid='GHCND', locationid='FIPS:12017', stationid='GHCND:USC00084289')
#> $meta
#> NULL
#>
#> $data
#>   elevation    mindate    maxdate latitude                  name datacoverage
#> 1      17.7 1899-01-01 2021-11-08 28.80286 INVERNESS 3 SE, FL US            1
#>                  id elevationUnit longitude
#> 1 GHCND:USC00084289        METERS -82.31266
#>
#> attr(,"class")
#> [1] "ncdc_stations"
Search for data
out <- ncdc(datasetid='NORMAL_DLY', stationid='GHCND:USW00014895', datatypeid='dly-tmax-normal', startdate = '2010-05-01', enddate = '2010-05-10')See a data.frame
head( out$data )
#> # A tibble: 6 × 5
#>   date                datatype        station           value fl_c
#>   <chr>               <chr>           <chr>             <int> <chr>
#> 1 2010-05-01T00:00:00 DLY-TMAX-NORMAL GHCND:USW00014895   652 S
#> 2 2010-05-02T00:00:00 DLY-TMAX-NORMAL GHCND:USW00014895   655 S
#> 3 2010-05-03T00:00:00 DLY-TMAX-NORMAL GHCND:USW00014895   658 S
#> 4 2010-05-04T00:00:00 DLY-TMAX-NORMAL GHCND:USW00014895   661 S
#> 5 2010-05-05T00:00:00 DLY-TMAX-NORMAL GHCND:USW00014895   663 S
#> 6 2010-05-06T00:00:00 DLY-TMAX-NORMAL GHCND:USW00014895   666 S
Note that the value column has strangely large numbers
for temperature measurements. By convention, rnoaa doesn’t
do any conversion of values from the APIs and some APIs use seemingly
odd units.
You have two options here:
Use the
add_unitsparameter onncdcto havernoaaattempt to look up the units. This is a good idea to try first.Consult the documentation for whiechever dataset you’re accessing. In this case,
GHCNDhas a README (https://www1.ncdc.noaa.gov/pub/data/ghcn/daily/readme.txt) which indicatesTMAXis measured in tenths of degrees Celcius.
See a data.frame with units
As mentioned above, you can use the add_units parameter
with ncdc() to ask rnoaa to attempt to look up
units for whatever data you ask it to return. Let’s ask
rnoaa to add units to some precipitation (PRCP) data:
with_units <- ncdc(datasetid='GHCND', stationid='GHCND:USW00014895', datatypeid='PRCP', startdate = '2010-05-01', enddate = '2010-10-31', limit=500, add_units = TRUE)
head( with_units$data )
#> # A tibble: 6 × 9
#>   date                datatype station      value fl_m  fl_q  fl_so fl_t  units
#>   <chr>               <chr>    <chr>        <int> <chr> <chr> <chr> <chr> <chr>
#> 1 2010-05-01T00:00:00 PRCP     GHCND:USW00…     0 "T"   ""    0     2400  mm_te…
#> 2 2010-05-02T00:00:00 PRCP     GHCND:USW00…    30 ""    ""    0     2400  mm_te…
#> 3 2010-05-03T00:00:00 PRCP     GHCND:USW00…    51 ""    ""    0     2400  mm_te…
#> 4 2010-05-04T00:00:00 PRCP     GHCND:USW00…     0 "T"   ""    0     2400  mm_te…
#> 5 2010-05-05T00:00:00 PRCP     GHCND:USW00…    18 ""    ""    0     2400  mm_te…
#> 6 2010-05-06T00:00:00 PRCP     GHCND:USW00…    30 ""    ""    0     2400  mm_te…
From the above output, we can see that the units for
PRCP values are “mm_tenths” which means tenths of a
millimeter. You won’t always be so lucky and sometimes you will have to
look up the documentation on your own.
Plot data, super simple, but it’s a start
out <- ncdc(datasetid='GHCND', stationid='GHCND:USW00014895', datatypeid='PRCP', startdate = '2010-05-01', enddate = '2010-10-31', limit=500)
ncdc_plot(out, breaks="1 month", dateformat="%d/%m")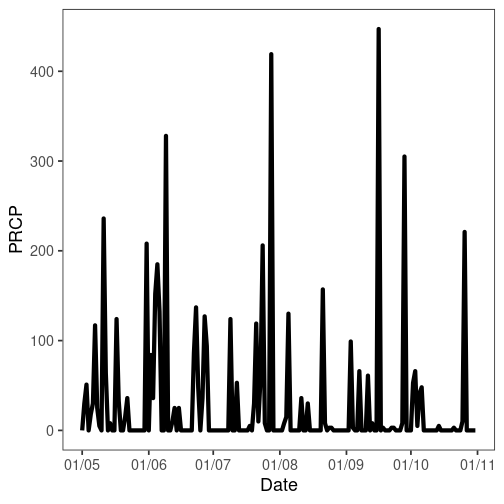
Note that PRCP values are in units of tenths of a
millimeter, as we found out above.
More plotting
You can pass many outputs from calls to the noaa
function in to the ncdc_plot function.
out1 <- ncdc(datasetid='GHCND', stationid='GHCND:USW00014895', datatypeid='PRCP', startdate = '2010-03-01', enddate = '2010-05-31', limit=500)
out2 <- ncdc(datasetid='GHCND', stationid='GHCND:USW00014895', datatypeid='PRCP', startdate = '2010-09-01', enddate = '2010-10-31', limit=500)
ncdc_plot(out1, out2, breaks="45 days")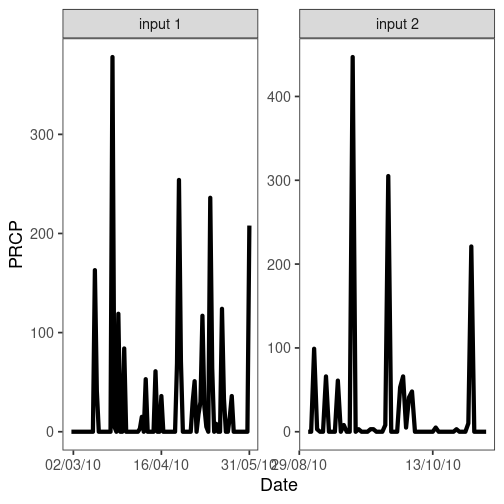
Get table of all datasets
ncdc_datasets()
#> $meta
#> $meta$offset
#> [1] 1
#>
#> $meta$count
#> [1] 11
#>
#> $meta$limit
#> [1] 25
#>
#>
#> $data
#>                     uid    mindate    maxdate                        name
#> 1  gov.noaa.ncdc:C00861 1763-01-01 2021-11-25             Daily Summaries
#> 2  gov.noaa.ncdc:C00946 1763-01-01 2021-11-01 Global Summary of the Month
#> 3  gov.noaa.ncdc:C00947 1763-01-01 2021-01-01  Global Summary of the Year
#> 4  gov.noaa.ncdc:C00345 1991-06-05 2021-11-25    Weather Radar (Level II)
#> 5  gov.noaa.ncdc:C00708 1994-05-20 2021-11-24   Weather Radar (Level III)
#> 6  gov.noaa.ncdc:C00821 2010-01-01 2010-01-01     Normals Annual/Seasonal
#> 7  gov.noaa.ncdc:C00823 2010-01-01 2010-12-31               Normals Daily
#> 8  gov.noaa.ncdc:C00824 2010-01-01 2010-12-31              Normals Hourly
#> 9  gov.noaa.ncdc:C00822 2010-01-01 2010-12-01             Normals Monthly
#> 10 gov.noaa.ncdc:C00505 1970-05-12 2014-01-01     Precipitation 15 Minute
#> 11 gov.noaa.ncdc:C00313 1900-01-01 2014-01-01        Precipitation Hourly
#>    datacoverage         id
#> 1          1.00      GHCND
#> 2          1.00       GSOM
#> 3          1.00       GSOY
#> 4          0.95    NEXRAD2
#> 5          0.95    NEXRAD3
#> 6          1.00 NORMAL_ANN
#> 7          1.00 NORMAL_DLY
#> 8          1.00 NORMAL_HLY
#> 9          1.00 NORMAL_MLY
#> 10         0.25  PRECIP_15
#> 11         1.00 PRECIP_HLY
#>
#> attr(,"class")
#> [1] "ncdc_datasets"
Get data category data and metadata
ncdc_datacats(locationid = 'CITY:US390029')
#> $meta
#> $meta$totalCount
#> [1] 39
#>
#> $meta$pageCount
#> [1] 25
#>
#> $meta$offset
#> [1] 1
#>
#>
#> $data
#>                     name            id
#> 1    Annual Agricultural        ANNAGR
#> 2     Annual Degree Days         ANNDD
#> 3   Annual Precipitation       ANNPRCP
#> 4     Annual Temperature       ANNTEMP
#> 5    Autumn Agricultural         AUAGR
#> 6     Autumn Degree Days          AUDD
#> 7   Autumn Precipitation        AUPRCP
#> 8     Autumn Temperature        AUTEMP
#> 9               Computed          COMP
#> 10 Computed Agricultural       COMPAGR
#> 11           Degree Days            DD
#> 12      Dual-Pol Moments DUALPOLMOMENT
#> 13             Echo Tops       ECHOTOP
#> 14      Hydrometeor Type   HYDROMETEOR
#> 15            Miscellany          MISC
#> 16                 Other         OTHER
#> 17               Overlay       OVERLAY
#> 18         Precipitation          PRCP
#> 19          Reflectivity  REFLECTIVITY
#> 20    Sky cover & clouds           SKY
#> 21   Spring Agricultural         SPAGR
#> 22    Spring Degree Days          SPDD
#> 23  Spring Precipitation        SPPRCP
#> 24    Spring Temperature        SPTEMP
#> 25   Summer Agricultural         SUAGR
#>
#> attr(,"class")
#> [1] "ncdc_datacats"
Tornado data
The function tornadoes() simply gets all the
data. So the call takes a while, but once done, is fun to play
with.
HOMR metadata
In this example, search for metadata for a single station ID
homr(qid = 'COOP:046742')Argo buoys data
There are a suite of functions for Argo data, a few egs:
# Spatial search - by bounding box
argo_search("coord", box = c(-40, 35, 3, 2))

# Time based search
argo_search("coord", yearmin = 2007, yearmax = 2009)

# Data quality based search
argo_search("coord", pres_qc = "A", temp_qc = "A")

# Search on partial float id number
argo_qwmo(qwmo = 49)

# Get data
argo(dac = "meds", id = 4900881, cycle = 127, dtype = "D")
CO-OPS data
Get daily mean water level data at Fairport, OH (9063053)
coops_search(station_name = 9063053, begin_date = 20150927, end_date = 20150928,
             product = "daily_mean", datum = "stnd", time_zone = "lst")
#> $metadata
#> $metadata$id
#> [1] "9063053"
#>
#> $metadata$name
#> [1] "Fairport"
#>
#> $metadata$lat
#> [1] "41.7597"
#>
#> $metadata$lon
#> [1] "-81.2811"
#>
#>
#> $data
#>            t       v   f
#> 1 2015-09-27 174.430 0,0
#> 2 2015-09-28 174.422 0,0
Additional vignettes
For additional vignettes see https://docs.ropensci.org/rnoaa/