Introduction
The GSOD or Global Surface Summary of the Day (GSOD) data provided by the US National Centers for Environmental Information (NCEI) are a valuable source of weather data with global coverage. However, the data files are cumbersome and difficult to work with. {GSODR} aims to make it easy to find, transfer and format the data you need for use in analysis and provides four main functions for facilitating this:
get_GSOD()- this function queries and transfers files from the NCEI’s web server, reformats them and returns a data frame.reformat_GSOD()- this function takes individual station files from the local disk and re-formats them returning a data frame.nearest_stations()- this function returns adata.tableof stations with their metadata and the distance in which they fall from the given radius (kilometres) of a point given as latitude and longitude in order from nearest to farthest.get_updates()- this function downloads the changelog for the GSOD data from the NCEI’s server and reorders it by the most recent changes first.
When reformatting data either with get_GSOD() or
reformat_GSOD(), all units are converted from United States
Customary System (USCS) to International System of Units (SI),
e.g., inches to millimetres and Fahrenheit to Celsius. Data in
the R session summarise each year by station, which also includes vapour
pressure and relative humidity elements calculated from existing data in
GSOD.
For more information see the description of the data provided by NCEI, https://www.ncei.noaa.gov/data/global-summary-of-the-day/doc/readme.txt.
Using get_GSOD()
Find Stations in or near Toowoomba, Queensland, Australia
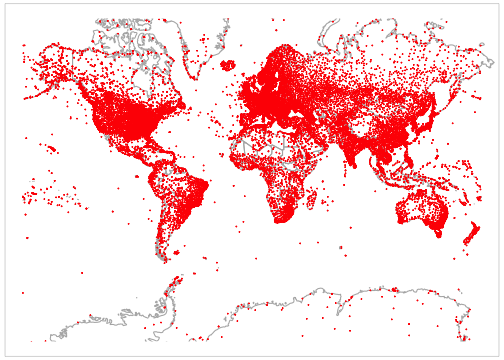
{GSODR} provides lists of weather station locations and elevation values. It’s easy to find all stations in Australia.
library("GSODR")

load(system.file("extdata", "isd_history.rda", package = "GSODR"))

# create data.frame for Australia only
Oz <- subset(isd_history, COUNTRY_NAME == "AUSTRALIA")

Oz
## Key: <STNID>
## STNID NAME LAT LON ELEV(M) CTRY
## <char> <char> <num> <num> <num> <char>
## 1: 695023-99999 HORN ISLAND (HID) -10.583 142.300 NA AS
## 2: 749430-99999 AIDELAIDE RIVER SE -13.300 131.133 131.0 AS
## 3: 749432-99999 BATCHELOR FIELD AUSTRALIA -13.049 131.066 107.0 AS
## 4: 749438-99999 IRON RANGE AUSTRALIA -12.700 143.300 18.0 AS
## 5: 749439-99999 MAREEBA AS/HOEVETT FIELD -17.050 145.400 443.0 AS
## ---
## 1252: 959810-99999 ST HELENS AERODROME -41.333 148.267 49.0 AS
## 1253: 959820-99999 STORYS CREEK AWS -41.617 147.733 781.0 AS
## 1254: 959830-99999 SCAMANDER -41.467 148.267 3.0 AS
## 1255: 959840-99999 ORFORD -42.550 147.867 15.0 AS
## 1256: 999999-82101 NORTHWEST CAPE -22.333 114.050 38.1 AS
## STATE BEGIN END COUNTRY_NAME ISO2C ISO3C
## <char> <int> <int> <char> <char> <char>
## 1: 19420804 20030816 AUSTRALIA AU AUS
## 2: 19430228 19440821 AUSTRALIA AU AUS
## 3: 19421231 19430610 AUSTRALIA AU AUS
## 4: 19420917 19440930 AUSTRALIA AU AUS
## 5: 19420630 19440630 AUSTRALIA AU AUS
## ---
## 1252: 20010918 20250824 AUSTRALIA AU AUS
## 1253: 19900201 19971231 AUSTRALIA AU AUS
## 1254: 19740228 20130328 AUSTRALIA AU AUS
## 1255: 19900201 20230924 AUSTRALIA AU AUS
## 1256: 19680305 19680430 AUSTRALIA AU AUS## Key: <STNID>
## STNID NAME LAT LON ELEV(M) CTRY STATE
## <char> <char> <num> <num> <num> <char> <char>
## 1: 945510-99999 TOOWOOMBA -27.583 151.933 676 AS
## 2: 955510-99999 TOOWOOMBA AIRPORT -27.550 151.917 642 AS
## BEGIN END COUNTRY_NAME ISO2C ISO3C
## <int> <int> <char> <char> <char>
## 1: 19561231 19971231 AUSTRALIA AU AUS
## 2: 19980301 20250824 AUSTRALIA AU AUSDownload a Single Station and Year Using get_GSOD()
Now that we’ve seen where the reporting stations are located, we can
download weather data from the station Toowoomba, Queensland, Australia
for 2010 by using the STNID in the station parameter of
get_GSOD().
## Classes 'data.table' and 'data.frame':   365 obs. of  47 variables:
##  $ STNID           : chr  "955510-99999" "955510-99999" "955510-99999" "955510-99999" ...
##  $ NAME            : chr  "TOOWOOMBA AIRPORT" "TOOWOOMBA AIRPORT" "TOOWOOMBA AIRPORT" "TOOWOOMBA AIRPORT" ...
##  $ CTRY            : chr  "AS" "AS" "AS" "AS" ...
##  $ COUNTRY_NAME    : chr  "AUSTRALIA" "AUSTRALIA" "AUSTRALIA" "AUSTRALIA" ...
##  $ ISO2C           : chr  "AU" "AU" "AU" "AU" ...
##  $ ISO3C           : chr  "AUS" "AUS" "AUS" "AUS" ...
##  $ STATE           : chr  "" "" "" "" ...
##  $ LATITUDE        : num  -27.6 -27.6 -27.6 -27.6 -27.6 ...
##  $ LONGITUDE       : num  152 152 152 152 152 ...
##  $ ELEVATION       : num  642 642 642 642 642 642 642 642 642 642 ...
##  $ BEGIN           : int  19980301 19980301 19980301 19980301 19980301 19980301 19980301 19980301 19980301 19980301 ...
##  $ END             : int  20250824 20250824 20250824 20250824 20250824 20250824 20250824 20250824 20250824 20250824 ...
##  $ YEARMODA        : Date, format: "2010-01-01" "2010-01-02" ...
##  $ YEAR            : int  2010 2010 2010 2010 2010 2010 2010 2010 2010 2010 ...
##  $ MONTH           : int  1 1 1 1 1 1 1 1 1 1 ...
##  $ DAY             : int  1 2 3 4 5 6 7 8 9 10 ...
##  $ YDAY            : int  1 2 3 4 5 6 7 8 9 10 ...
##  $ TEMP            : num  21.2 23.2 21.4 18.9 20.5 21.9 21.3 20.9 21.9 22.3 ...
##  $ TEMP_ATTRIBUTES : int  8 8 8 8 8 8 8 8 8 8 ...
##  $ DEWP            : num  17.9 19.4 18.9 16.4 16.4 18.7 17.4 17.1 16.2 14.9 ...
##  $ DEWP_ATTRIBUTES : int  8 8 8 8 8 8 8 8 8 8 ...
##  $ SLP             : num  1013 1010 1012 1016 1016 ...
##  $ SLP_ATTRIBUTES  : int  8 8 8 8 8 8 8 8 8 8 ...
##  $ STP             : num  942 939 941 944 944 ...
##  $ STP_ATTRIBUTES  : int  8 8 8 8 8 8 8 8 8 8 ...
##  $ VISIB           : num  NA NA 14.3 23.3 NA NA NA NA NA NA ...
##  $ VISIB_ATTRIBUTES: int  0 0 6 4 0 0 0 0 0 0 ...
##  $ WDSP            : num  4.3 3.7 7.6 8.7 7.5 6.3 7.8 7.5 6.8 6.3 ...
##  $ WDSP_ATTRIBUTES : int  8 8 8 8 8 8 8 8 8 8 ...
##  $ MXSPD           : num  6.7 5.1 10.3 10.3 10.8 7.7 8.7 8.7 8.2 7.2 ...
##  $ GUST            : num  NA NA NA NA NA NA NA NA NA NA ...
##  $ MAX             : num  25.8 26.5 28.7 24.1 24.6 26.8 26.1 26.5 27.4 28.7 ...
##  $ MAX_ATTRIBUTES  : chr  NA NA NA NA ...
##  $ MIN             : num  17.8 19.1 19.3 16.9 16.7 17.5 19.1 18.5 17.8 17.7 ...
##  $ MIN_ATTRIBUTES  : chr  NA NA "*" "*" ...
##  $ PRCP            : num  1.52 0.25 19.81 1.02 0.25 ...
##  $ PRCP_ATTRIBUTES : chr  "G" "G" "G" "G" ...
##  $ SNDP            : num  NA NA NA NA NA NA NA NA NA NA ...
##  $ I_FOG           : num  0 0 1 0 0 1 1 0 1 1 ...
##  $ I_RAIN_DRIZZLE  : num  0 0 1 0 0 0 0 0 0 0 ...
##  $ I_SNOW_ICE      : num  0 0 0 0 0 0 0 0 0 0 ...
##  $ I_HAIL          : num  0 0 0 0 0 0 0 0 0 0 ...
##  $ I_THUNDER       : num  0 0 0 0 0 0 0 0 0 0 ...
##  $ I_TORNADO_FUNNEL: num  0 0 0 0 0 0 0 0 0 0 ...
##  $ EA              : num  2 2.2 2.2 1.9 1.9 2.2 2 1.9 1.8 1.7 ...
##  $ ES              : num  2.5 2.8 2.5 2.2 2.4 2.6 2.5 2.5 2.6 2.7 ...
##  $ RH              : num  81.5 79.2 85.7 85.4 77.3 82.1 78.5 78.9 70.1 62.9 ...
##  - attr(*, ".internal.selfref")=<externalptr>
Using nearest_stations() to Download Multiple Stations at Once
Using the nearest_stations() function, you can find
stations closest to a given point specified by latitude and longitude in
decimal degrees. This can be used to generate a vector to pass along to
get_GSOD() and download the stations of interest.
Warning messages will be generated as not all stations have data for the requested year.
tbar_stations <- nearest_stations(LAT = -27.5598,
                                  LON = 151.9507,
                                  distance = 50)$STNID

tbar <- get_GSOD(years = 2010, station = tbar_stations)
## Warning:
## This station, 945510-99999, only provides data for years 1956 to 1997.
## Please send a request that falls within these years.## Warning:
## This station, 949999-00170, only provides data for years 1971 to 1984.
## Please send a request that falls within these years.## Warning:
## This station, 949999-00183, only provides data for years 1983 to 1984.
## Please send a request that falls within these years.
str(tbar)## Classes 'data.table' and 'data.frame': 1095 obs. of 47 variables:
## $ STNID : chr "945520-99999" "945520-99999" "945520-99999" "945520-99999" ...
## $ NAME : chr "OAKEY" "OAKEY" "OAKEY" "OAKEY" ...
## $ CTRY : chr "AS" "AS" "AS" "AS" ...
## $ COUNTRY_NAME : chr "AUSTRALIA" "AUSTRALIA" "AUSTRALIA" "AUSTRALIA" ...
## $ ISO2C : chr "AU" "AU" "AU" "AU" ...
## $ ISO3C : chr "AUS" "AUS" "AUS" "AUS" ...
## $ STATE : chr "" "" "" "" ...
## $ LATITUDE : num -27.4 -27.4 -27.4 -27.4 -27.4 ...
## $ LONGITUDE : num 152 152 152 152 152 ...
## $ ELEVATION : num 407 407 407 407 407 ...
## $ BEGIN : int 19730430 19730430 19730430 19730430 19730430 19730430 19730430 19730430 19730430 19730430 ...
## $ END : int 20250824 20250824 20250824 20250824 20250824 20250824 20250824 20250824 20250824 20250824 ...
## $ YEARMODA : Date, format: "2010-01-01" "2010-01-02" ...
## $ YEAR : int 2010 2010 2010 2010 2010 2010 2010 2010 2010 2010 ...
## $ MONTH : int 1 1 1 1 1 1 1 1 1 1 ...
## $ DAY : int 1 2 3 4 5 6 7 8 9 10 ...
## $ YDAY : int 1 2 3 4 5 6 7 8 9 10 ...
## $ TEMP : num 23.4 26.2 24.5 21.6 22.6 24.7 24 23.3 24.4 25.1 ...
## $ TEMP_ATTRIBUTES : int 16 16 16 16 16 16 16 16 16 16 ...
## $ DEWP : num 18.4 19.4 19.4 16.8 16.9 18.7 17.1 17.1 15.7 13.6 ...
## $ DEWP_ATTRIBUTES : int 16 16 16 16 16 16 16 16 16 16 ...
## $ SLP : num 1012 1009 1011 1015 1015 ...
## $ SLP_ATTRIBUTES : int 16 16 16 16 16 16 16 16 16 16 ...
## $ STP : num 967 964 966 969 969 ...
## $ STP_ATTRIBUTES : int 16 16 16 16 16 16 16 16 16 16 ...
## $ VISIB : num NA NA NA NA NA NA NA NA NA NA ...
## $ VISIB_ATTRIBUTES: int 0 0 0 0 0 0 0 0 0 0 ...
## $ WDSP : num 4.3 4.1 6.1 7.5 4.4 4.3 5.8 6.2 5.6 4.5 ...
## $ WDSP_ATTRIBUTES : int 16 16 16 16 16 16 16 16 16 16 ...
## $ MXSPD : num 7.2 6.2 8.7 9.8 7.7 6.2 8.2 9.3 7.7 7.2 ...
## $ GUST : num NA NA NA NA NA NA NA NA NA NA ...
## $ MAX : num 28.5 31.2 33.6 27.1 27.8 30.4 30 30.5 31.9 33.2 ...
## $ MAX_ATTRIBUTES : chr NA NA NA NA ...
## $ MIN : num 19.5 20.5 21.3 18.8 18.4 18.6 20.6 18.6 17.2 16.2 ...
## $ MIN_ATTRIBUTES : chr NA NA "*" "*" ...
## $ PRCP : num 0.51 0 3.3 0 0 0 0 0.25 0 0 ...
## $ PRCP_ATTRIBUTES : chr "G" "G" "G" "G" ...
## $ SNDP : num NA NA NA NA NA NA NA NA NA NA ...
## $ I_FOG : num 0 0 0 0 0 0 0 0 0 0 ...
## $ I_RAIN_DRIZZLE : num 0 0 0 0 0 0 0 0 0 0 ...
## $ I_SNOW_ICE : num 0 0 0 0 0 0 0 0 0 0 ...
## $ I_HAIL : num 0 0 0 0 0 0 0 0 0 0 ...
## $ I_THUNDER : num 0 0 0 0 0 0 0 0 0 0 ...
## $ I_TORNADO_FUNNEL: num 0 0 0 0 0 0 0 0 0 0 ...
## $ EA : num 2.1 2.2 2.2 1.9 1.9 2.2 1.9 1.9 1.8 1.6 ...
## $ ES : num 2.9 3.4 3.1 2.6 2.7 3.1 3 2.9 3.1 3.2 ...
## $ RH : num 73.5 66.2 73.3 74.2 70.2 69.3 65.3 68.2 58.4 48.9 ...
## - attr(*, ".internal.selfref")=<externalptr>Plot Maximum and Minimum Temperature Values
Using the first data downloaded for a single station, 955510-99999, plot the temperature for 2010.
library("ggplot2")
library("tidyr")

# Create a dataframe of just the date and temperature values that we want to
# plot
tbar_temps <- tbar[, c("YEARMODA", "TEMP", "MAX", "MIN")]

# Gather the data from wide to long
tbar_temps <-
  pivot_longer(tbar_temps, cols = TEMP:MIN, names_to = "Measurement")

ggplot(data = tbar_temps, aes(x = YEARMODA,
                              y = value,
                              colour = Measurement)) +
  geom_line() +
  scale_color_brewer(type = "qual", na.value = "black") +
  scale_y_continuous(name = "Temperature") +
  scale_x_date(name = "Date") +
  ggtitle(label = "Max, min and mean temperatures for Toowoomba, Qld, AU",
          subtitle = "Data: U.S. NCEI GSOD") +
  theme_classic()
plot of chunk Ex5
Using reformat_GSOD()
You may have already downloaded GSOD data or may just wish to use
your browser to download the files from the server to you local disk and
not use the capabilities of get_GSOD(). In that case the
reformat_GSOD() function is useful.
There are two ways, you can either provide
reformat_GSOD() with a list of specified station files or
you can supply it with a directory containing all of the “STATION.csv”
station files or “YEAR.zip” annual files that you wish to reformat.
Note Any .csv file provided to
reformat_GSOD() will be imported, if it is not a GSOD data
file, this will lead to an error. Make sure the directory and file lists
are clean.
Reformat a List of Local Files
In this example two STATION.csv files are in subdirectories of user’s home directory and are listed for reformatting as a string.
y <- c("~/GSOD/gsod_1960/20049099999.csv",
       "~/GSOD/gsod_1961/20049099999.csv")
x <- reformat_GSOD(file_list = y)
Reformat all Local Files Found in Directory
In this example all STATION.csv files in the sub-folder GSOD/gsod_1960 will be imported and reformatted.
x <- reformat_GSOD(dsn = "~/GSOD/gsod_1960")Using get_updates()
{GSODR} provides a function, get_updates(), to retrieve
the changelog for the GSOD data and return it in order from newest to
oldest changes to the data set.
Following is an example how to use this function.
##              STNID  YEAR       DATE                  COMMENT
##             <char> <int>     <Date>                   <char>
##    1: ******-*****  2025 2025-08-29 ENTIRE YEAR WAS REPLACED
##    2: ******-*****  2024 2025-01-21 ENTIRE YEAR WAS REPLACED
##    3: ******-*****  2023 2024-01-05 ENTIRE YEAR WAS REPLACED
##    4: ******-*****  2022 2023-05-18 ENTIRE YEAR WAS REPLACED
##    5: ******-*****  1997 2022-08-31 ENTIRE YEAR WAS REPLACED
##   ---
## 5451: ******-*****  1968 2004-11-12 ENTIRE YEAR WAS REPLACED
## 5452: ******-*****  1969 2004-11-12 ENTIRE YEAR WAS REPLACED
## 5453: ******-*****  1970 2004-11-10 ENTIRE YEAR WAS REPLACED
## 5454: ******-*****  1971 2004-11-10 ENTIRE YEAR WAS REPLACED
## 5455: ******-*****  1972 2004-11-09 ENTIRE YEAR WAS REPLACED
Notes
WMO Resolution 40. NOAA Policy
The data summaries provided here are based on data exchanged under the World Meteorological Organization (WMO) World Weather Watch Program according to WMO Resolution 40 (Cg-XII). This allows WMO member countries to place restrictions on the use or re-export of their data for commercial purposes outside of the receiving country. Data for selected countries may, at times, not be available through this system. Those countries’ data summaries and products which are available here are intended for free and unrestricted use in research, education, and other non-commercial activities. However, for non-U.S. locations’ data, the data or any derived product shall not be provided to other users or be used for the re-export of commercial services.
Appendices
Appendix 1: GSODR Final Data Format, Contents and Units
{GSODR} formatted data include the following fields and units:
STNID - Station number (WMO/DATSAV3 number) for the location;
NAME - Unique text identifier;
CTRY - Country in which the station is located. This field is the original FIPS code that NCEI provides;
COUNTRY_NAME - Country in which the station is located. This field is the country name in English language;
ISO2C - Country in which the station is located. This field is the two letter ISO country code;
ISO3C - Country in which the station is located. This field is the three letter ISO country code;
LAT - Latitude. Station dropped in cases where values are < -90 or > 90 degrees or Lat = 0 and Lon = 0;
LON - Longitude. Station dropped in cases where values are < -180 or > 180 degrees or Lat = 0 and Lon = 0;
ELEVATION - Elevation in metres;
YEARMODA - Date in YYYYMMDD format;
YEAR - The year (YYYY);
MONTH - The month (mm);
DAY - The day (dd);
YDAY - Sequential day of year (not in original GSOD);
TEMP - Mean daily temperature converted to degrees C to tenths. Missing =
NA;TEMP_ATTRIBUTES - Number of observations used in calculating mean daily temperature;
DEWP - Mean daily dew point converted to degrees C to tenths. Missing =
NA;DEWP_ATTRIBUTES - Number of observations used in calculating mean daily dew point;
SLP - Mean sea level pressure in millibars to tenths. Missing =
NA;SLP_ATTRIBUTES - Number of observations used in calculating mean sea level pressure;
STP - Mean station pressure for the day in millibars to tenths. Missing =
NA;STP_ATTRIBUTES - Number of observations used in calculating mean station pressure;
VISIB - Mean visibility for the day converted to kilometres to tenths. Missing =
NA;VISIB_ATTRIBUTES - Number of observations used in calculating mean daily visibility;
WDSP - Mean daily wind speed value converted to metres/second to tenths. Missing =
NA;WDSP_ATTRIBUTES - Number of observations used in calculating mean daily wind speed;
MXSPD - Maximum sustained wind speed reported for the day converted to metres/second to tenths. Missing =
NA;GUST - Maximum wind gust reported for the day converted to metres/second to tenths. Missing =
NA;MAX - Maximum temperature reported during the day converted to Celsius to tenths–time of max temp report varies by country and region, so this will sometimes not be the max for the calendar day. Missing =
NA;MAX_ATTRIBUTES - Blank indicates max temp was taken from the explicit max temp report and not from the ‘hourly’ data. An “*” indicates max temp was derived from the hourly data (i.e., highest hourly or synoptic-reported temperature);
MIN - Minimum temperature reported during the day converted to Celsius to tenths–time of min temp report varies by country and region, so this will sometimes not be the max for the calendar day. Missing =
NA;MIN_ATTRIBUTES - Blank indicates max temp was taken from the explicit min temp report and not from the ‘hourly’ data. An “*” indicates min temp was derived from the hourly data (i.e., highest hourly or synoptic-reported temperature);
PRCP - Total precipitation (rain and/or melted snow) reported during the day converted to millimetres to hundredths; will usually not end with the midnight observation, i.e., may include latter part of previous day. A value of “.00” indicates no measurable precipitation (includes a trace). Missing = NA; Note: Many stations do not report ‘0’ on days with no precipitation– therefore,
NAwill often appear on these days. For example, a station may only report a 6-hour amount for the period during which rain fell. SeeFLAGS_PRCPcolumn for source of data;-
PRCP_ATTRIBUTES -
A = 1 report of 6-hour precipitation amount;
B = Summation of 2 reports of 6-hour precipitation amount;
C = Summation of 3 reports of 6-hour precipitation amount;
D = Summation of 4 reports of 6-hour precipitation amount;
E = 1 report of 12-hour precipitation amount;
F = Summation of 2 reports of 12-hour precipitation amount;
G = 1 report of 24-hour precipitation amount;
H = Station reported ‘0’ as the amount for the day (e.g. from 6-hour reports), but also reported at least one occurrence of precipitation in hourly observations–this could indicate a trace occurred, but should be considered as incomplete data for the day;
I = Station did not report any precipitation data for the day and did not report any occurrences of precipitation in its hourly observations–it’s still possible that precipitation occurred but was not reported;
SNDP - Snow depth in millimetres to tenths. Missing =
NA;I_FOG - Indicator for fog, (1 = yes, 0 = no/not reported) for the occurrence during the day;
I_RAIN_DRIZZLE - Indicator for rain or drizzle, (1 = yes, 0 = no/not reported) for the occurrence during the day;
I_SNOW_ICE - Indicator for snow or ice pellets, (1 = yes, 0 = no/not reported) for the occurrence during the day;
I_HAIL - Indicator for hail, (1 = yes, 0 = no/not reported) for the occurrence during the day;
I_THUNDER - Indicator for thunder, (1 = yes, 0 = no/not reported) for the occurrence during the day;
I_TORNADO_FUNNEL - Indicator for tornado or funnel cloud, (1 = yes, 0 = no/not reported) for the occurrence during the day;
EA - Mean daily actual vapour pressure as calculated using improved August-Roche-Magnus approximation (Alduchov and Eskridge 1996). Missing =
NA;ES - Mean daily saturation vapour pressure as calculated using improved August-Roche-Magnus approximation (Alduchov and Eskridge 1996). Missing =
NA;RH - Mean daily relative humidity as calculated using improved August-Roche-Magnus approximation (Alduchov and Eskridge 1996). Missing =
NA.