summary method for the class kb.test
Usage
# S4 method for class 'kb.test'
summary(object)Value
List with the following components:
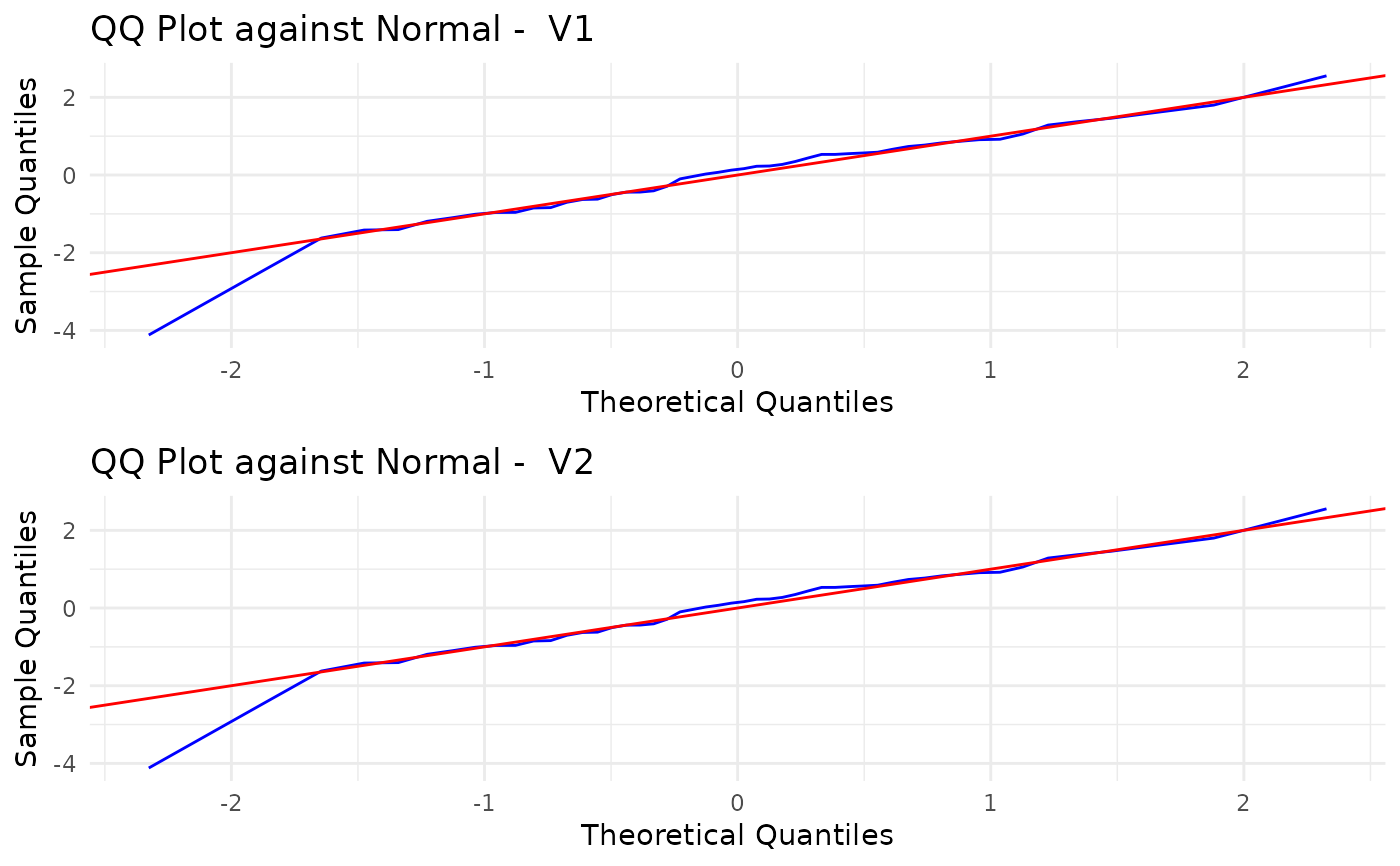
summary_tablesTable of computed descriptive statistics per variable (and per group if available).test_resultsData frame with the results of the performed kernel-based quadratic distance test.qqplotsFigure with qq-plots for each variable.
See also
kb.test() for more details.
Examples
# create a kb.test object
x <- matrix(rnorm(100),ncol=2)
# Normality test
my_test <- kb.test(x, h=0.5, mu = c(0,0), Sigma = diag(2))
summary(my_test)

#>
#>  Kernel-based quadratic distance Normality test
#>   Statistic       Value Critical_Value Reject_H0
#> 1        Un -0.07807674       1.734051     FALSE
#> 2        Vn  0.55877213       6.071062     FALSE
#> $summary_tables
#>                V1          V2
#> mean    0.2225601 -0.01276311
#> sd      1.0933236  1.14937193
#> median  0.2061474  0.14471308
#> IQR     1.3443250  1.40042674
#> min    -1.5643294 -4.11865455
#> max     3.5340310  2.55373421
#>
#> $test_results
#>   Statistic       Value Critical_Value Reject_H0
#> 1        Un -0.07807674       1.734051     FALSE
#> 2        Vn  0.55877213       6.071062     FALSE
#>
#> $qqplots

#>
#> Kernel-based quadratic distance Normality test
#> Statistic Value Critical_Value Reject_H0
#> 1 Un -0.07807674 1.734051 FALSE
#> 2 Vn 0.55877213 6.071062 FALSE
#> $summary_tables
#> V1 V2
#> mean 0.2225601 -0.01276311
#> sd 1.0933236 1.14937193
#> median 0.2061474 0.14471308
#> IQR 1.3443250 1.40042674
#> min -1.5643294 -4.11865455
#> max 3.5340310 2.55373421
#>
#> $test_results
#> Statistic Value Critical_Value Reject_H0
#> 1 Un -0.07807674 1.734051 FALSE
#> 2 Vn 0.55877213 6.071062 FALSE
#>
#> $qqplots
 #>
#>