Provide a map (image) of sites in an eLTER Network.
Source:R/produce_network_points_map.R
produce_network_points_map.Rd![[Stable]](figures/lifecycle-stable.svg) Return a image map object of all of the eLTER sites belonging
to an eLTER Network (e.g.
LTER
Italy network), as a stored into DEIMS-SDR.
Return a image map object of all of the eLTER sites belonging
to an eLTER Network (e.g.
LTER
Italy network), as a stored into DEIMS-SDR.
Arguments
- networkDEIMSID
A
character. The DEIMS ID of the network from DEIMS-SDR website. DEIMS ID information here and Complete list of ILTER networks here.- countryCode
A
characterfollowing the ISO 3166-1 alpha-3 codes. This ISO convention consists of three-letter country codes as defined in ISO 3166-1. The ISO 3166 standard published by the International Organization for Standardization (ISO), to represent countries, dependent territories, and special areas of geographical interest. The map produced by this function will be limited only to the country indicated in this parameter, if the network has a extraterritorial sites those will not represented.
Value
The output of the function is a ggplot2 plot containing an image of
geographic distribution of the network of sites present in the chosen
country. If the network contains extraterritorial sites, a map of these can
be generated by specifying the network’s DEIMS-ID and providing, in the
country parameter, the country in which the extraterritorial sites are
located.
Author
Alessandro Oggioni, phD (2020) oggioni.a@irea.cnr.it
Examples
if (FALSE) { # \dontrun{
# Italian sites
map <- produce_network_points_map(
networkDEIMSID =
"https://deims.org/networks/7fef6b73-e5cb-4cd2-b438-ed32eb1504b3",
countryCode = "ITA"
)
# Italian extraterritorial sites (Nepal)
map <- produce_network_points_map(
networkDEIMSID =
"https://deims.org/networks/7fef6b73-e5cb-4cd2-b438-ed32eb1504b3",
countryCode = "NPL"
)
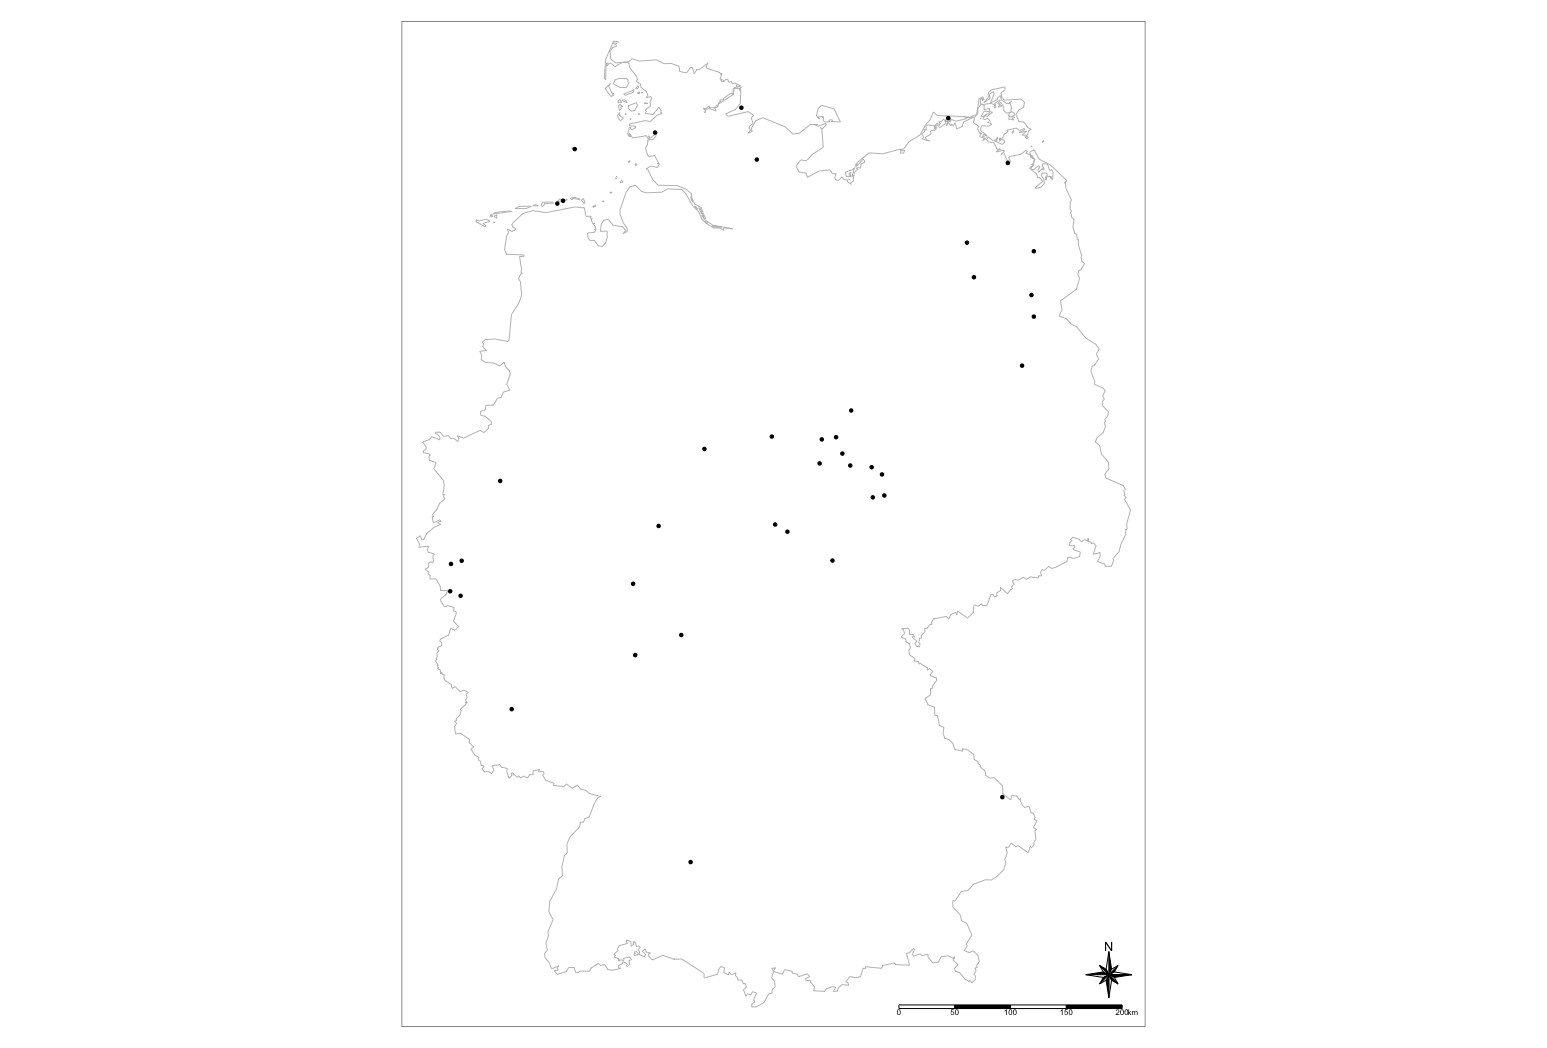
# German sites
map_LTERGermanSites <- produce_network_points_map(
networkDEIMSID =
"https://deims.org/networks/e904354a-f3a0-40ce-a9b5-61741f66c824",
countryCode = "DEU"
)
# Remove scale bar and a north arrow
map_LTERGermanSites <- map_LTERGermanSites +
ggplot2::theme(
panel.grid = ggplot2::element_blank(),
axis.text = ggplot2::element_blank(),
axis.ticks = ggplot2::element_blank(),
axis.title = ggplot2::element_blank()
)
map_LTERGermanSites
# Add annotation scale and North arrow
map_LTERGermanSites <- map_LTERGermanSites +
ggspatial::annotation_scale(
location = "br", # bottom right
width_hint = 0.2) +
ggspatial::annotation_north_arrow(
location = "bl", # bottom right
which_north = "true",
style = ggspatial::north_arrow_fancy_orienteering(),
height = ggplot2::unit(1, "cm"),
width = ggplot2::unit(1, "cm")
)
map_LTERGermanSites
} # }