Produce a pie chart of the observed properties collected in a site LTER.
Source:R/produce_site_observedProperties_pie.R
produce_site_observedProperties_pie.Rd![[Stable]](figures/lifecycle-stable.svg) Return a pie chart of Environmental observed properties, as
a stored in DEIMS-SDR catalogue, of a single
eLTER site.
Return a pie chart of Environmental observed properties, as
a stored in DEIMS-SDR catalogue, of a single
eLTER site.
Arguments
- deimsid
A
character. It is the DEIMS ID of site/network from DEIMS-SDR website. DEIMS ID information here.
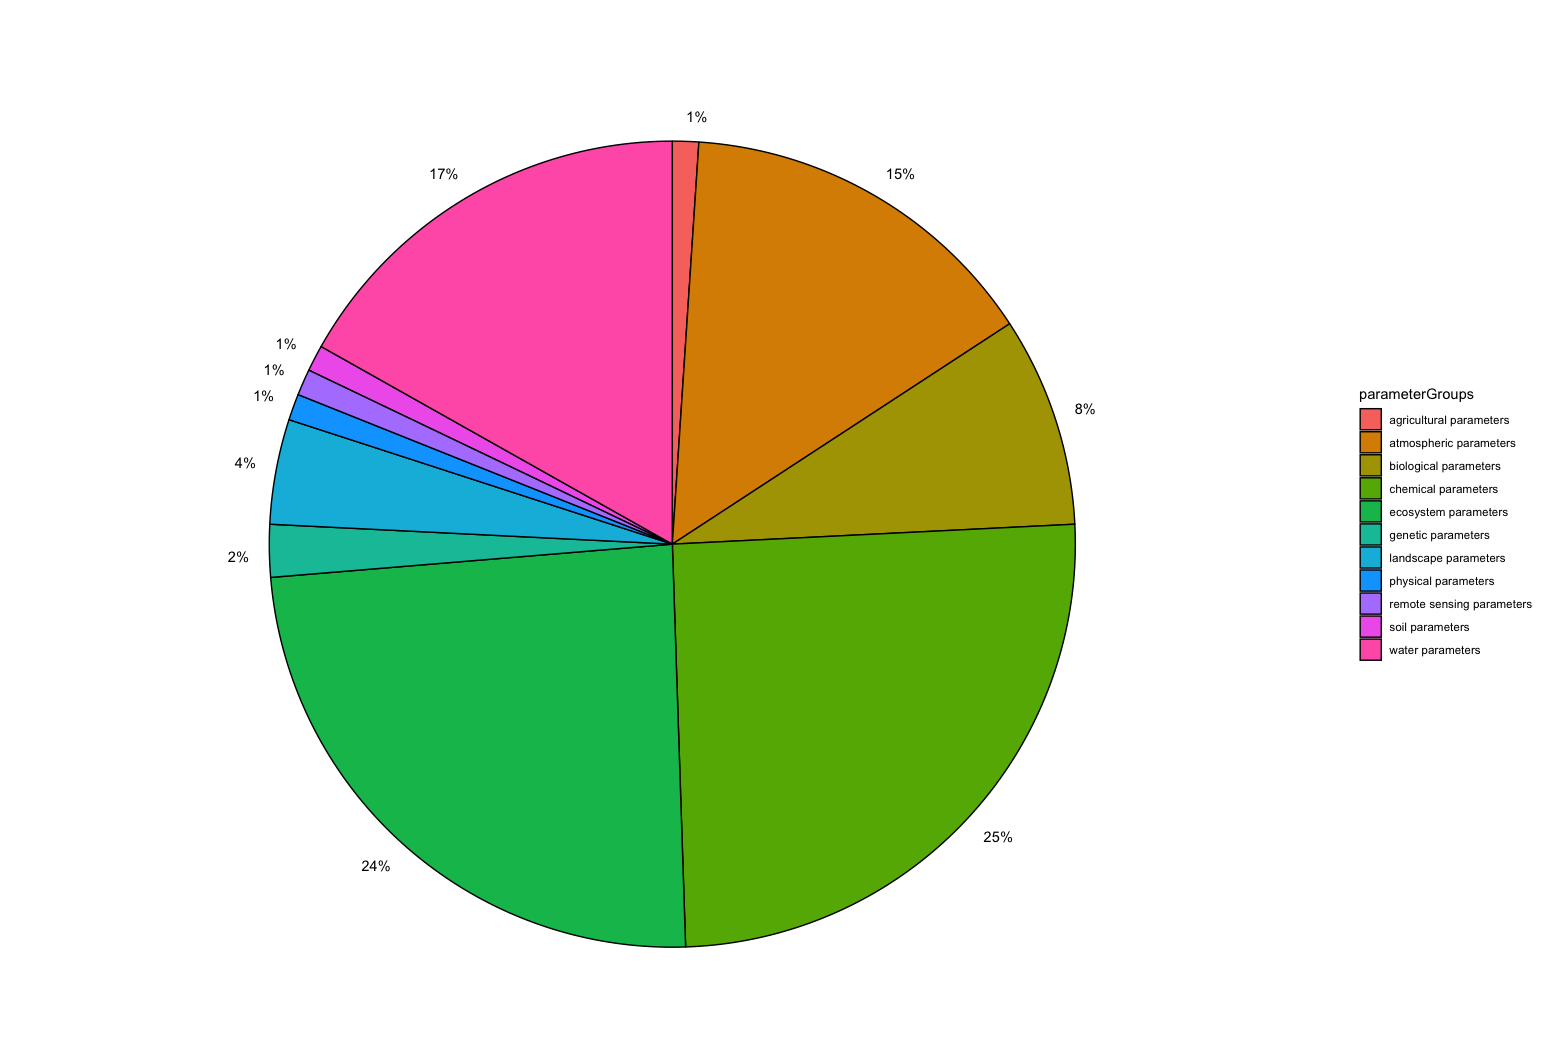
Value
The output of the function is a pie chart and a tibble. The
percentages, as a label in the pie charts and in the output table (
column 'perc'), refer to the number of the observed properties, belonging
to a type (e.g. biological, atmospheric, etc.), measured compared to all of
observed properties measured into selected eLTER site. This function allows
to show what type of observed properties are most measured into a site. In
the example below the atmospheric observed properties corresponds to the
15 percent of all observed properties measured into the site.
Author
Alessandro Oggioni, phD (2020) oggioni.a@irea.cnr.it