Produce a waffle chart of the observed properties collected in an eLTER site
Source:R/produce_site_observedProperties_waffle.R
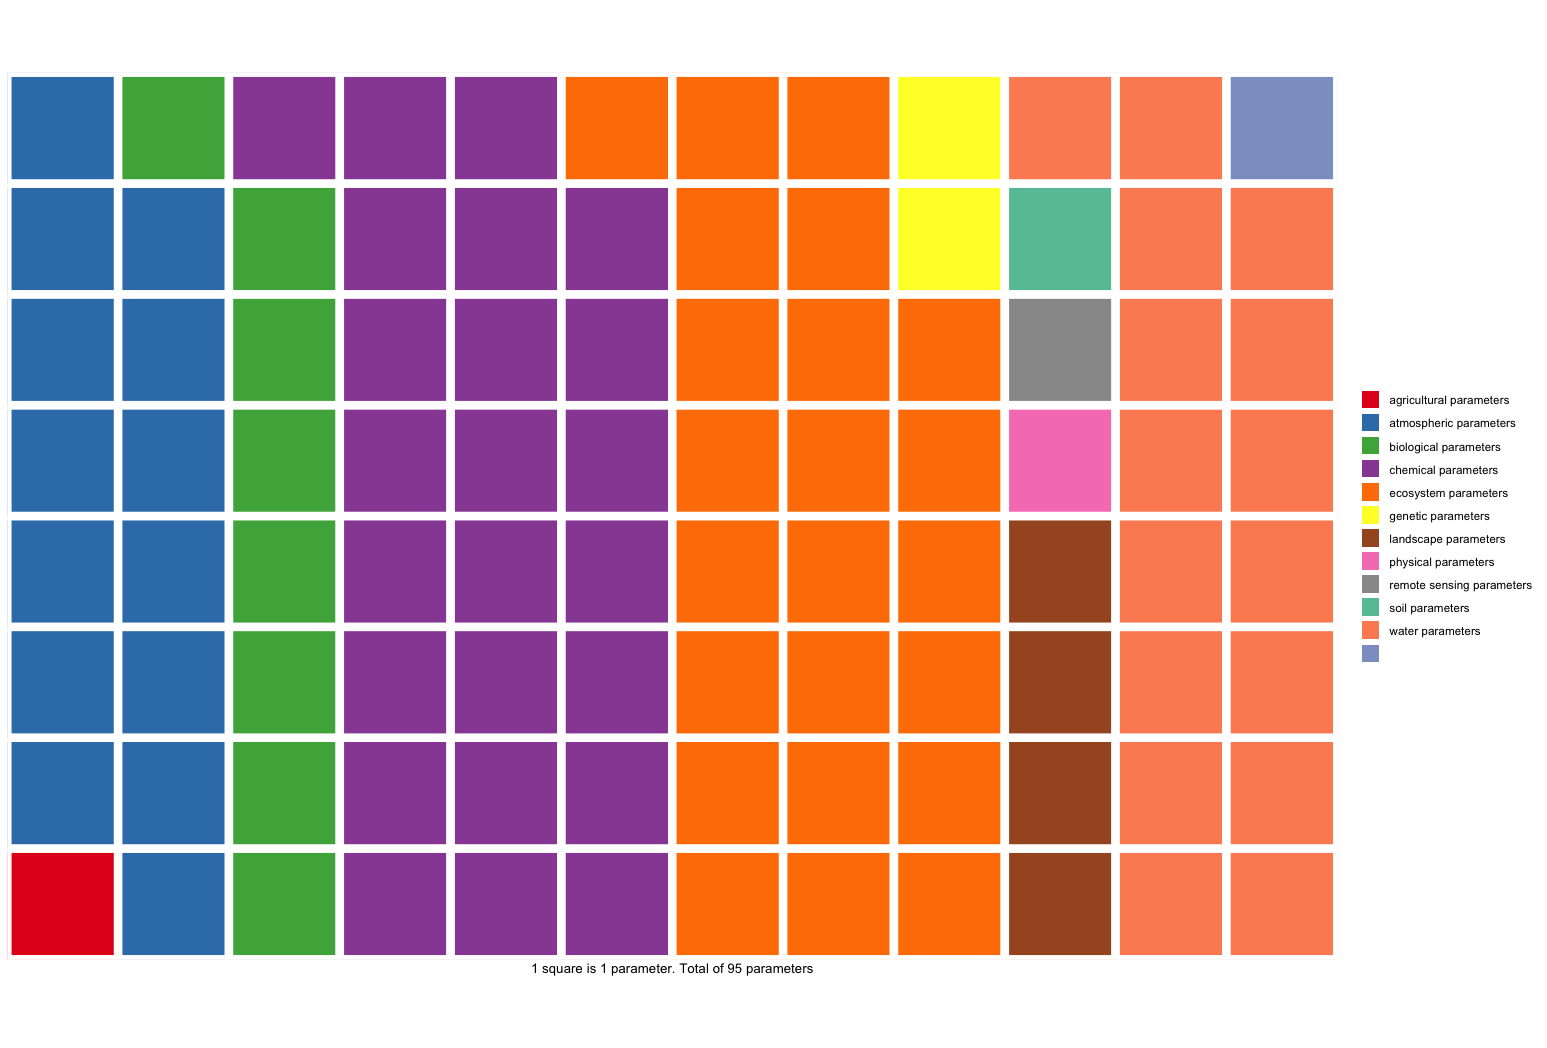
produce_site_observedProperties_waffle.Rd![[Stable]](figures/lifecycle-stable.svg) Returns a waffle chart of environmental observed properties, as stored in
DEIMS-SDR catalogue, for a single eLTER site.
The chart is built with ggplot2 and requires no additional packages.
Each square represents one observed property; squares of the same colour
belong to the same parameter group (e.g. biological, atmospheric, etc.).
Returns a waffle chart of environmental observed properties, as stored in
DEIMS-SDR catalogue, for a single eLTER site.
The chart is built with ggplot2 and requires no additional packages.
Each square represents one observed property; squares of the same colour
belong to the same parameter group (e.g. biological, atmospheric, etc.).
Arguments
- deimsid
A
character. The DEIMS ID of the site from DEIMS-SDR website. DEIMS ID information here.
Value
The function prints a waffle chart as a side effect and returns
a tibble with four columns:
parameterGroupscharacter. Name of the parameter group.ninteger. Number of observed properties in the group.freqdouble. Relative frequency of the group.labelcharacter. Percentage label for the group.
Returns invisible(NULL) if the DEIMS ID is invalid or the site has no
observed properties.
Author
Alessandro Oggioni, phD (2020) oggioni.a@irea.cnr.it