Making trend graphs
Najko Jahn
2023-09-20
Source:vignettes/evergreenreviewgraphs.Rmd
evergreenreviewgraphs.RmdTrend graphs in literature reviews show the development of concepts in scholarly communication. Some trend graphs, however, don’t acknowledge that the number of scholarly publications is growing each year, but simply display the absolute number of hits they have found for a given concept. Noam Ross called these misleading graphs evergreen review graphs because of their enduring popularity in review papers.
This vignette guides you how to make proper trend graphs when reviewing Europe PMC literature. In these graphs, the number of hits found is divided by the total number of records indexed in Europe PMC for a given search query.
Preparing proper review graphs with
epmc_hits_trend()
We use epmc_hits_trend() function, which was firstly
introduced in Maëlle Salmon’s blog post about “How not to make an
evergreen review graph”1. The function takes a query in the Europe
PMC search syntax2 and the period of years over which to
perform the search as arguments, and returns a data-frame with year,
total number of hits (all_hits) and number of hits for the
query (query_hits).
library(europepmc)
europepmc::epmc_hits_trend(query = "aspirin", period = 2010:2022)
#> # A tibble: 13 × 3
#>     year all_hits query_hits
#>    <int>    <dbl>      <dbl>
#>  1  2010   851106       5513
#>  2  2011   904847       6009
#>  3  2012   946206       6840
#>  4  2013  1004432       7658
#>  5  2014  1055201       8226
#>  6  2015  1096429       8789
#>  7  2016  1117164       8965
#>  8  2017  1138419       9411
#>  9  2018  1180115      10116
#> 10  2019  1243574      10675
#> 11  2020  1450562      14358
#> 12  2021  1550459      16755
#> 13  2022  1542959      16214
By default, synonym search is disabled and only Medline/PubMed index is searched.
Use Cases
Use Case: Growth of Open Access Literature
There is a growing interest in knowing the proportion of open access
to scholarly literature. Europe PMC allows searching for open access
content with the OPEN_ACCESS:Y
parameter. At the moment, Europe PMC contains 5,641,836 open access
full-texts. Let’s see how they are relatively distributed over the
period 2010 - 2022.
tt_oa <- europepmc::epmc_hits_trend("OPEN_ACCESS:Y", period = 2010:2022, synonym = FALSE)
tt_oa
#> # A tibble: 13 × 3
#>     year all_hits query_hits
#>    <int>    <dbl>      <dbl>
#>  1  2010   851106      78743
#>  2  2011   904847     105737
#>  3  2012   946206     140082
#>  4  2013  1004432     176617
#>  5  2014  1055201     212221
#>  6  2015  1096429     244342
#>  7  2016  1117164     273575
#>  8  2017  1138419     312877
#>  9  2018  1180115     352369
#> 10  2019  1243574     406182
#> 11  2020  1450562     585074
#> 12  2021  1550459     714651
#> 13  2022  1542959     794387
# we use ggplot2 for plotting the graph
library(ggplot2)
ggplot(tt_oa, aes(factor(year), query_hits / all_hits, group = 1)) +
  geom_point() +
  geom_line() +
  xlab("Year published") +
  ylab("Proportion of OA full-texts in Europe PMC")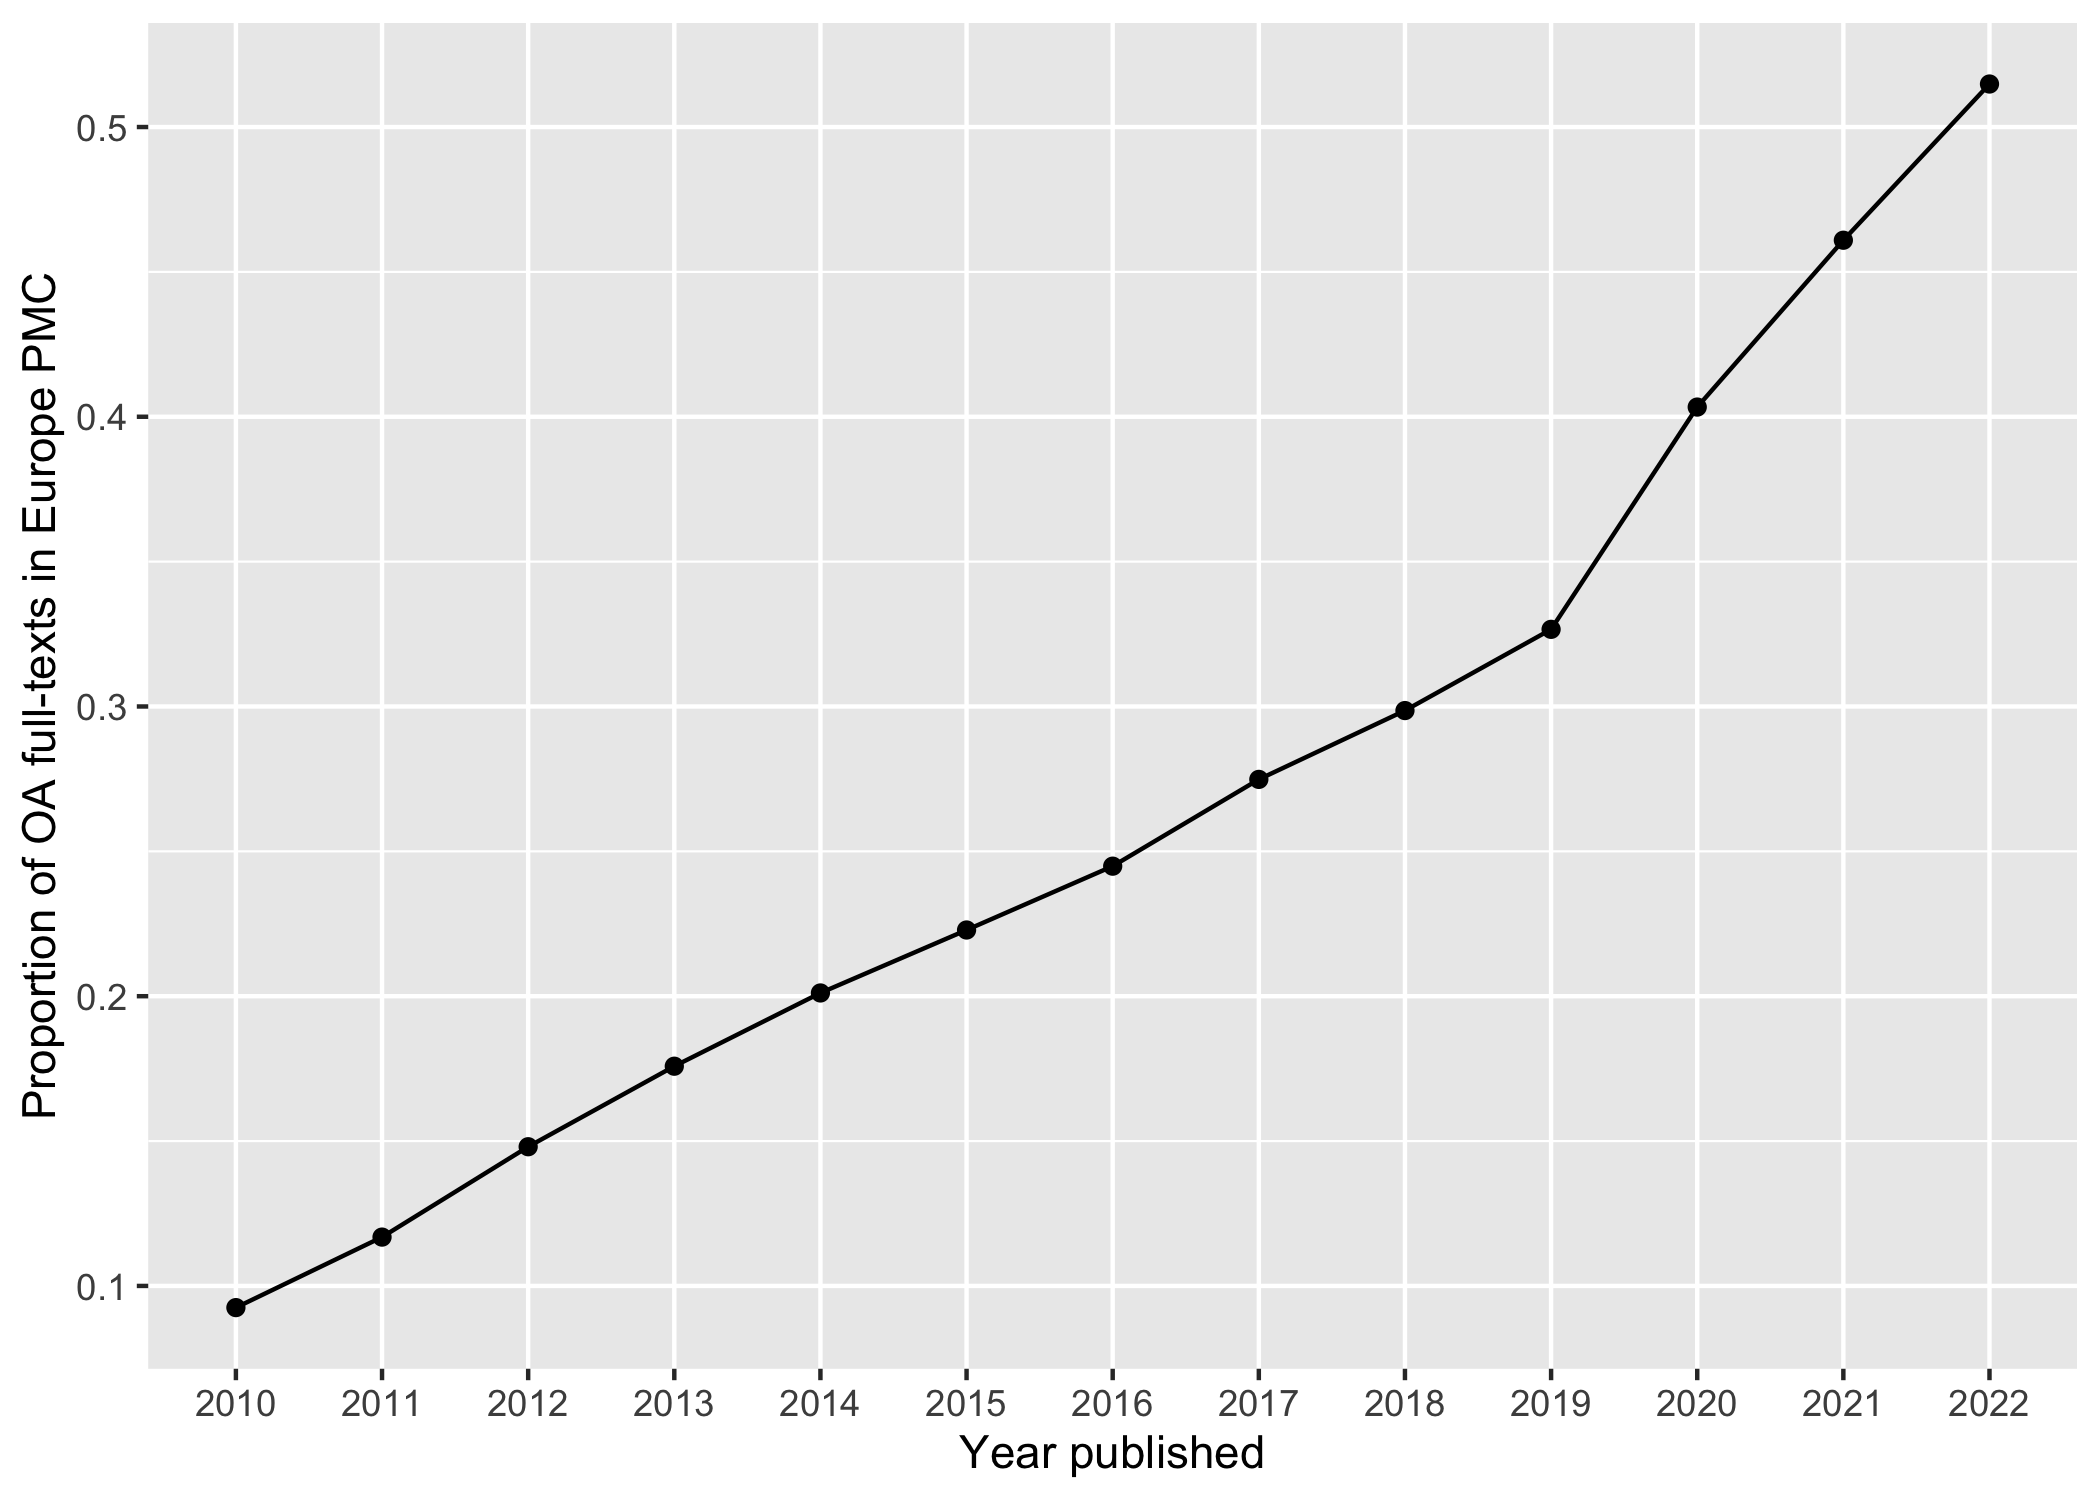
plot of chunk oa_pmc
Be careful with the interpretation of the slower growth in the last years because there are several ways how open access content is added to Europe PMC including the digitalization of back issues.3
Use Case: Cited open source software in scholarly publications
Another nice use case for trend graphs is to study how code and software repositories are cited in scientific literature. In recent years, it has become a good practice not only to re-use openly available software, but also to cite them. The FORCE11 Software Citation Working Group states:
In general, we believe that software should be cited on the same basis as any other research product such as a paper or book; that is, authors should cite the appropriate set of software products just as they cite the appropriate set of papers. (doi:10.7717/peerj-cs.86)
So let’s see whether we can find evidence for this evolving practice by creating a proper review graph. As a start, we examine these four general purpose hosting services for version-controlled code:
and, of course, CRAN, the R archive network.
How to query Europe PMC?
We only want to search reference lists. Because Europe PMC does not
index references for its complete collection, we use
has_reflist:y to restrict our search to those publications
with reference lists. These literature sections can be searched with the
REF: parameter.
Let’s prepare the queries for links to the above mentioned code hosting services:
dvcs <- c("code.google.com", "github.com",
          "sourceforge.net", "bitbucket.org", "cran.r-project.org")
# make queries including reference section
dvcs_query <- paste0('REF:"', dvcs, '"')
and get publications for which Europe PMC gives access to reference lists for normalizing the review graph.
library(dplyr)
my_df <- purrr::map_df(dvcs_query, function(x) {
  # get number of publications with indexed reference lists
  refs_hits <-
    europepmc::epmc_hits_trend("has_reflist:y", period = 2009:2022, synonym = FALSE)$query_hits
  # get hit count querying for code repositories
  europepmc::epmc_hits_trend(x, period = 2009:2022, synonym = FALSE) %>%
    dplyr::mutate(query_id = x) %>%
    dplyr::mutate(refs_hits = refs_hits) %>%
    dplyr::select(year, all_hits, refs_hits, query_hits, query_id)
})
my_df
#> # A tibble: 70 × 5
#>     year all_hits refs_hits query_hits query_id
#>    <int>    <dbl>     <dbl>      <dbl> <chr>
#>  1  2009   793210    556002         13 "REF:\"code.google.com\""
#>  2  2010   851106    541447         40 "REF:\"code.google.com\""
#>  3  2011   904847    604315         65 "REF:\"code.google.com\""
#>  4  2012   946206    636843         92 "REF:\"code.google.com\""
#>  5  2013  1004432    763720        135 "REF:\"code.google.com\""
#>  6  2014  1055201    797730        140 "REF:\"code.google.com\""
#>  7  2015  1096429    780777        117 "REF:\"code.google.com\""
#>  8  2016  1117164    784272         65 "REF:\"code.google.com\""
#>  9  2017  1138419    819735         52 "REF:\"code.google.com\""
#> 10  2018  1180115    757852         29 "REF:\"code.google.com\""
#> # ℹ 60 more rows

### total
hits_summary <- my_df %>%
  group_by(query_id) %>%
  summarise(all = sum(query_hits)) %>%
  arrange(desc(all))
hits_summary
#> # A tibble: 5 × 2
#>   query_id                       all
#>   <chr>                        <dbl>
#> 1 "REF:\"cran.r-project.org\"" 44864
#> 2 "REF:\"github.com\""         29009
#> 3 "REF:\"sourceforge.net\""     1779
#> 4 "REF:\"code.google.com\""      897
#> 5 "REF:\"bitbucket.org\""        442
The proportion of papers where Europe PMC was able to make the cited literature available was 64 for the period 2009-2022. There also seems to be a time-lag between indexing reference lists because the absolute number of publication was decreasing over the years. This is presumably because Europe PMC also includes delayed open access content, i.e. content which is not added immediately with the original publication.4
Now, let’s make a proper review graph normalizing our query results with the number of publications with indexed references.
library(ggplot2)
ggplot(my_df, aes(factor(year), query_hits / refs_hits, group = query_id,
                  color = query_id)) +
  geom_line(size = 1, alpha = 0.8) +
  geom_point(size = 2) +
  scale_color_brewer(name = "Query", palette = "Set1")+
  xlab("Year published") +
  ylab("Proportion of articles in Europe PMC")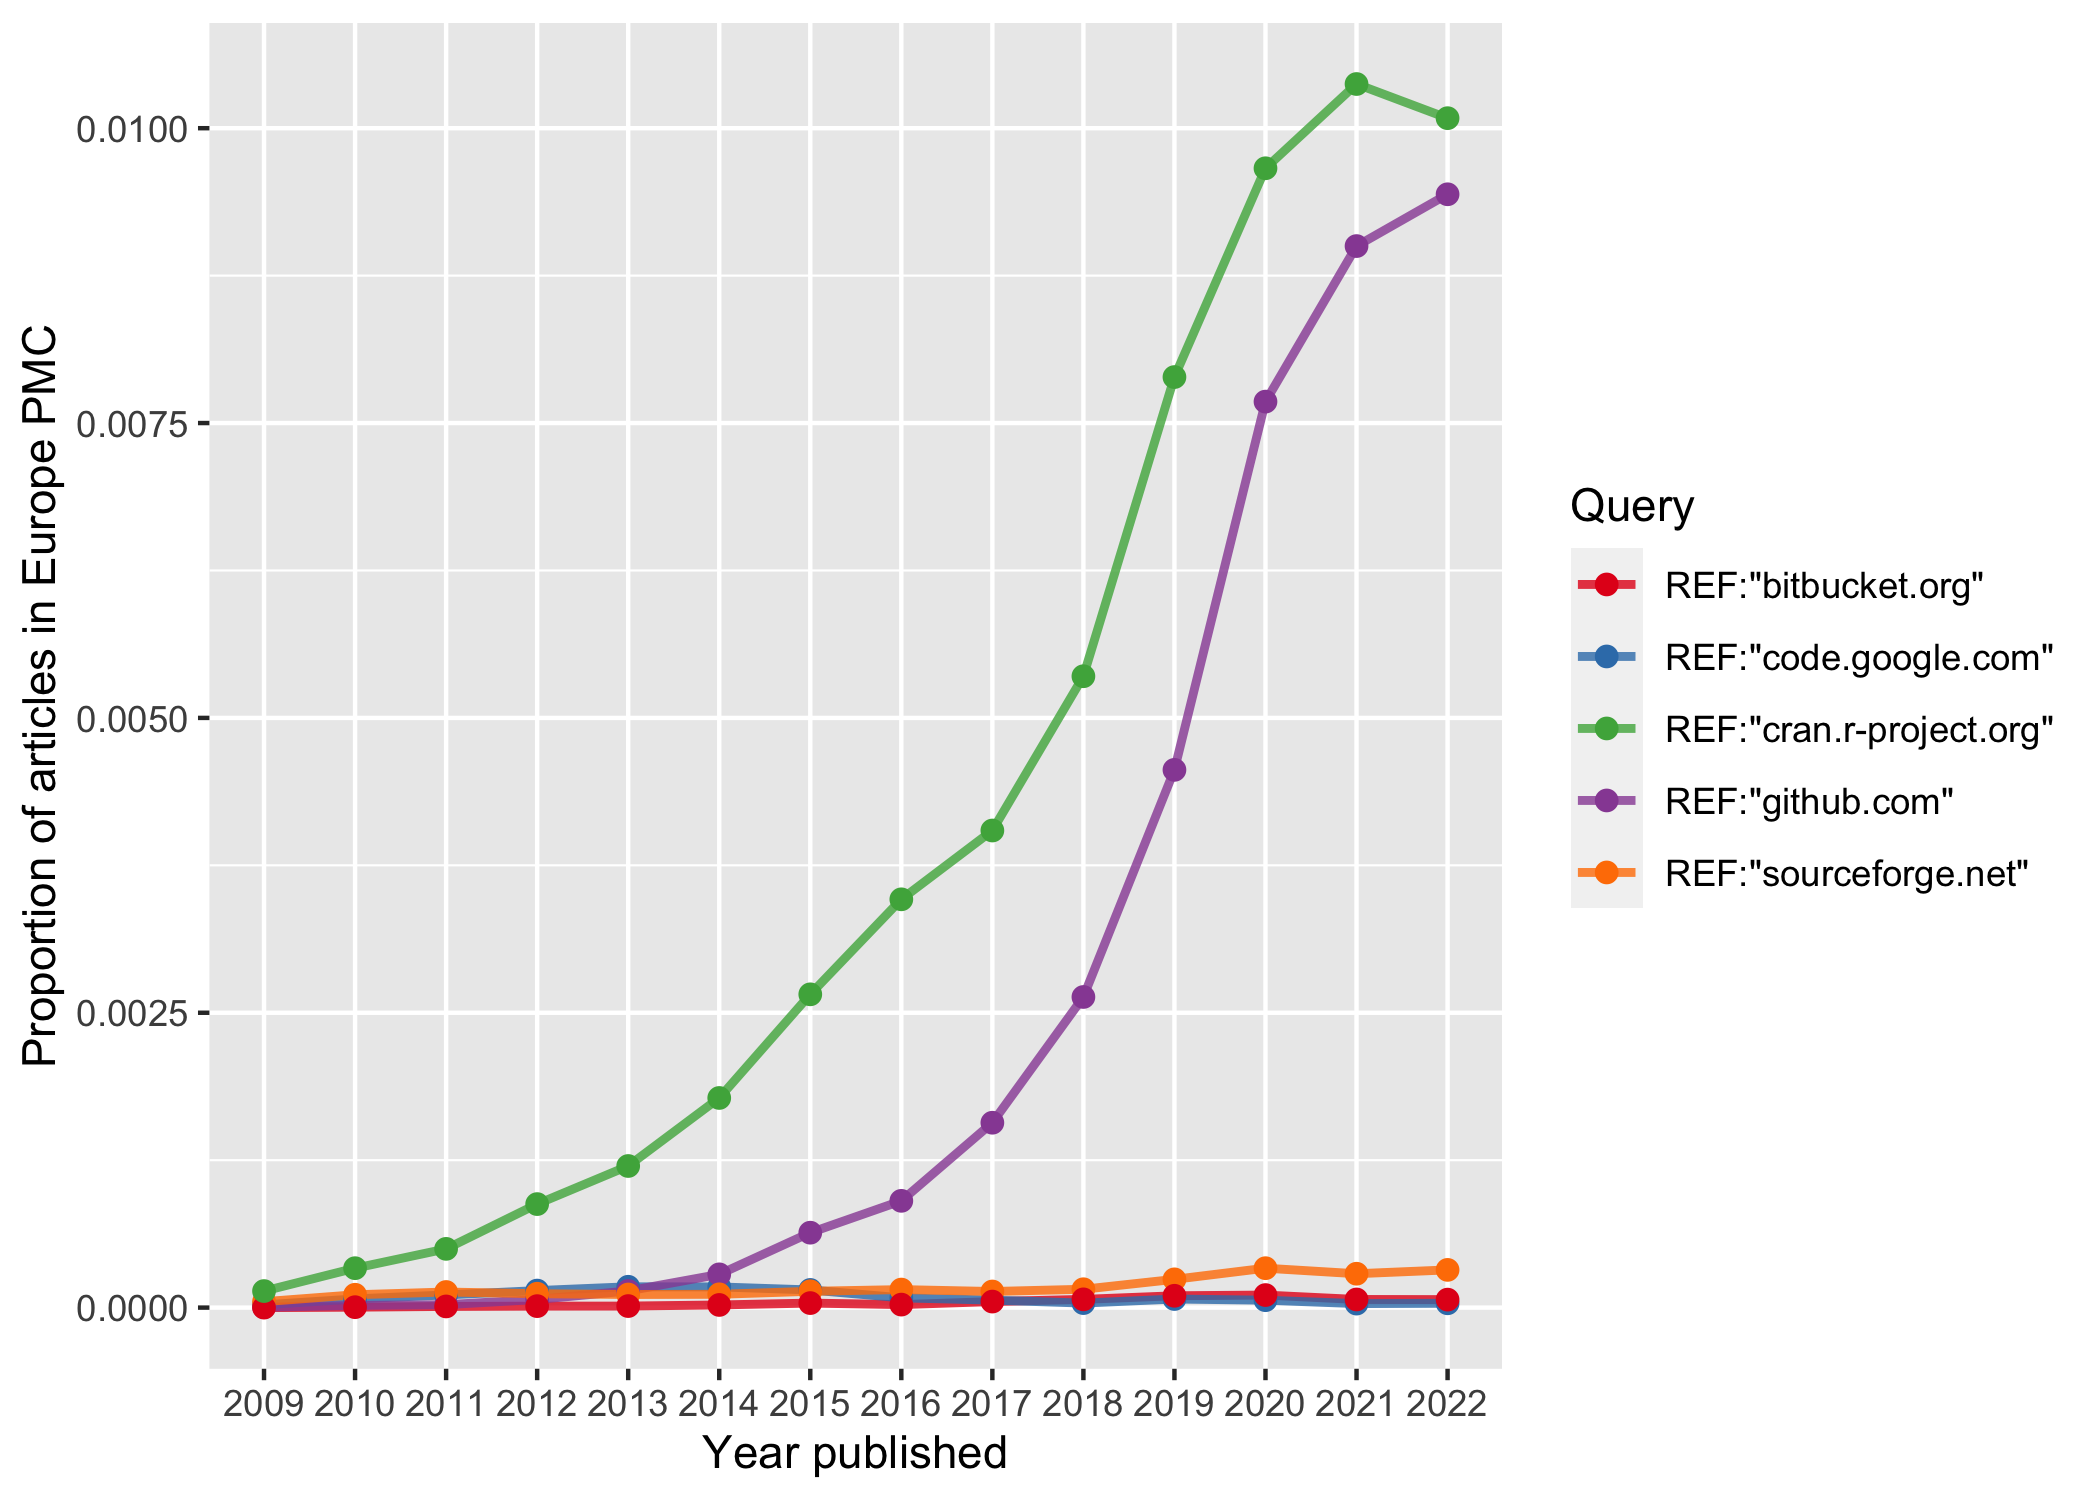
plot of chunk software_lit
Discussion and Conclusion
Although this figure illustrates the relative popularity of citing code hosted by CRAN and GitHub in recent years, there are some limits that needs to be discussed. As said before, Europe PMC does not extract reference lists from every indexed publication. It furthermore remains open whether and to what extent software is cited outside the reference section, i.e. as footnote or in the acknowledgements.
Another problem of our query approach is that we did not consider that DOIs can also be used to cite software, a best-practice implemented by Zenodo and GitHub or the The Journal of Open Source Software.
Lastly, it actually remains unclear, which and what kind of software is cited how often. We could also not control if authors just cited the homepages and not a particular source code repository. One paper can also cite more than one code repository, which is also not represented in the trend graph.
To conclude, a proper trend graph on the extent of software citation can only be the start for a more sophisticated approach that mines links to software repositories from scientific literature and fetches metadata about these code repositories from the hosting facilities.
Conclusion
This vignette presented first steps on how to make trend graphs with
europepmc. As our use-cases suggest, please carefully
consider how you queried Europe PMC in the interpretation of your graph.
Although trend graphs are a nice way to illustrate the development of
certain concepts in scientific literature or recent trends in scholarly
communication, they must be put in context in order to become
meaningful.