Package overview
The primary functions of the grainchanger package are
those which facilitate moving-window (winmove_agg) and
direct (nomove_agg) data aggregation. These functions
aggregate fine-grain data (fine_dat) to a coarse-grain
(coarse_dat) using a function specified by the user
(agg_fun). The moving-window method takes in an additional
function (win_fun) which smooths the fine-grain data prior
to aggregation.
The moving-window smoothing function is also available in the package
(winmove), as well as several built-in functions, and an
additional utility function for use with simulated landscapes
(create_torus).
The winmove function acts as a convenient wrapper to
raster::focalWeight and raster::focal which
takes advantage of optimised functions built into the
grainchanger package.
Data aggregation & sf
The functions in grainchanger have been written to be
compatible with the sf package. The
online textbook Geocomputation with R
provides an introduction to spatial data analysis with the
sf package.
Moving-window data aggregation
In this example, we show how to create a coarse grain grid over the
fine-grain data using st_make_grid from the sf
package. We then aggregate the package data cat_ls to this
grid using moving-window data aggregation and plot using
ggplot2.
library(grainchanger)
library(sf)
library(ggplot2)

coarse_dat <- cat_ls %>%
  # get the bounding box
  st_bbox() %>%
  # turn into an sfc object
  st_as_sfc() %>%
  # negative buffer
  st_buffer(-4) %>%
  # make a square grid
  st_make_grid(cellsize = 19) %>%
  # turn into sf object
  st_sf()

# we can plot this grid on top of the fine data
landscapetools::show_landscape(cat_ls) +
  geom_sf(data = coarse_dat, alpha = 0.5)
coarse_dat$shdi_3 <- winmove_agg(coarse_dat = coarse_dat,
                                 fine_dat = cat_ls,
                                 d = 3,
                                 type = "rectangle",
                                 win_fun = shdi,
                                 agg_fun = mean,
                                 is_grid = FALSE,
                                 lc_class = 1:4)

ggplot(coarse_dat, aes(fill = shdi_3)) +
  geom_sf() +
  theme_bw()
Note that when creating the grid, we made it 4 units smaller (the
size of the moving window) than the fine-resolution data. The reason for
this is that we avoid edge effects created when the moving window goes
beyond the extent of the data. A warning is thrown if
fine_dat is the same size as (or smaller than)
coarse_dat. The below is an example of this, using
g_sf from the package.
g_sf$shei_4 <- winmove_agg(coarse_dat = g_sf,
                                 fine_dat = cat_ls,
                                 d = 4,
                                 type = "rectangle",
                                 win_fun = shei,
                                 agg_fun = mean,
                                 is_grid = FALSE,
                                 lc_class = 1:4)
#> Warning: Moving window extends beyond extent of `fine_dat`
#> You will get edge effects for the following cells of `coarse_dat`:
#> 1,2,3,4,5,6,7,8,9
Direct data aggregation
In this example we show how to read in a shapefile as an
sf object, apply direct data aggregation, and plot using
ggplot2. cont_ls is a fine-resolution
RasterLayer provided with the package.
library(sf)
library(ggplot2)

# coarse_dat <- st_read("your_file.shp")
coarse_dat <- st_read(system.file("shape/poly_sf.shp", package="grainchanger"))
#> Reading layer `poly_sf' from data source
#>   `/github/home/R/x86_64-pc-linux-gnu-library/4.5/grainchanger/shape/poly_sf.shp'
#>   using driver `ESRI Shapefile'
#> Simple feature collection with 39 features and 1 field
#> Geometry type: POLYGON
#> Dimension:     XY
#> Bounding box:  xmin: -6.5 ymin: -7.505553 xmax: 71.5 ymax: 75.05553
#> CRS:           NA

coarse_dat$var_range <- nomove_agg(coarse_dat = coarse_dat,
                                   fine_dat = cont_ls,
                                   agg_fun = var_range,
                                   is_grid = FALSE)

ggplot(coarse_dat, aes(fill = var_range)) +
  geom_sf() +
  theme_bw()
Functions
There are a number of inbuilt functions in the grainchanger package,
with their usage outlined below. While it is possible to use
user-defined functions within both winmove_agg and
nomove_agg, we welcome suggestions for additional
functions. Please add as an
issue - doing it this way means we can maximise the speed of the
function.
| Function.Name | Description | Additional.arguments |
|---|---|---|
| prop | Calculate the proportion of a given class | lc_class (numeric) |
| shdi | Calculate the Shannon diversity | lc_class (numeric) |
| shei | Calculate the Shannon evenness | lc_class (numeric) |
| range | Calculate the range of values |
Additional utilities
Create torus
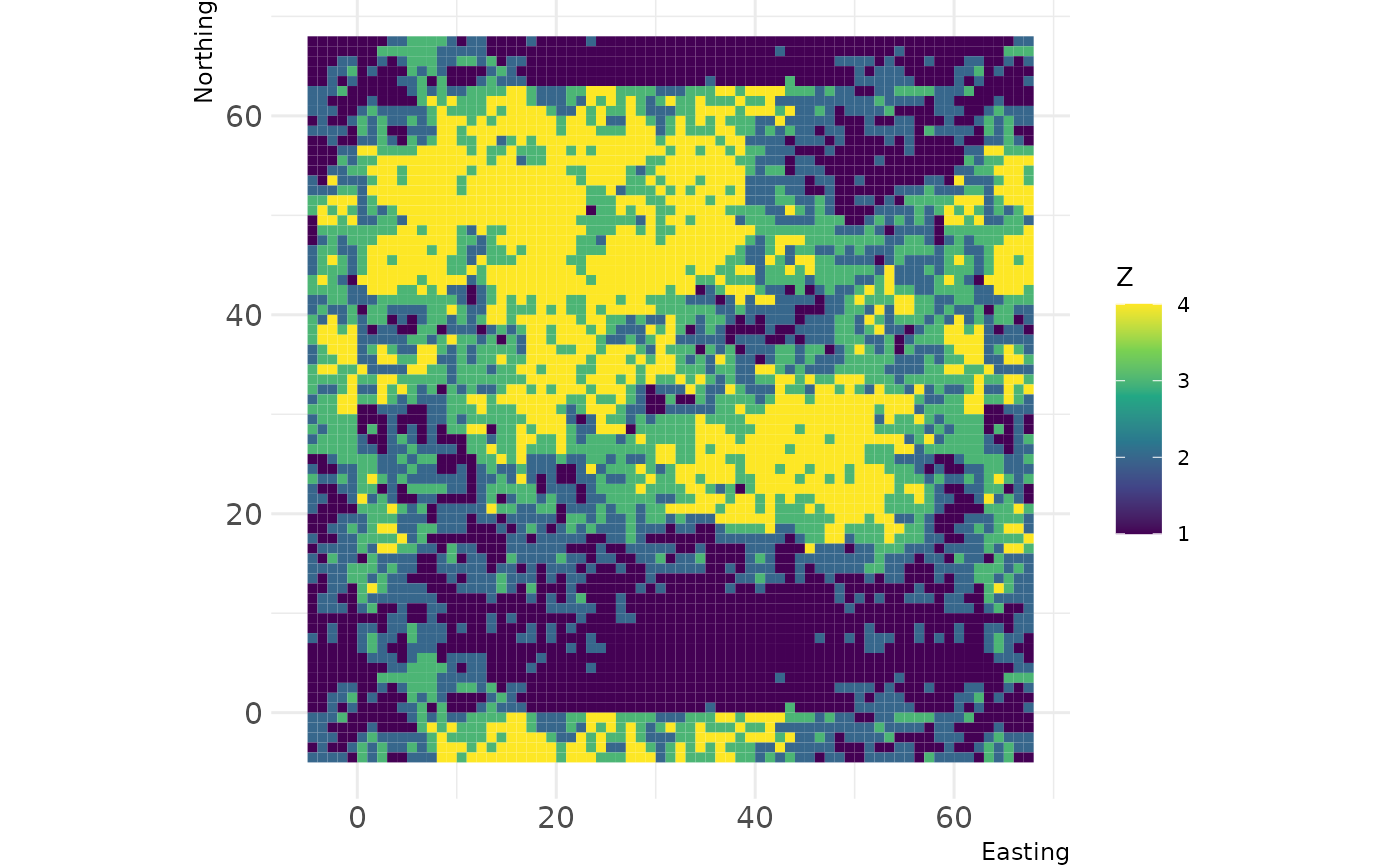
The create_torus function takes as input a square or
rectangular landscape and pads it by a specified radius, creating the
effect of a torus. We developed this function in order to avoid edge
effects when testing methods on simulated landscapes (such as those from
NLMR).
torus <- create_torus(cat_ls, 5)

landscapetools::show_landscape(torus)
Running aggregation in parallel
The winmove_agg and nomove_agg functions
have been designed to work with the future
package. This means that with just one additional line of code, the
functions can be run in parallel while taking advantage of the resources
available to the user.
library(future)
plan(multisession)
See the future
documentation for more information.
