ts_plot() is a fast and simple plotting function for ts-boxable time
series, with limited customizability. For more theme options, use
ts_ggplot().
Usage
ts_plot(..., title, subtitle, ylab = "", family = getOption("ts_font", "sans"))Details
Both ts_plot() and ts_ggplot() combine multiple ID dimensions into a
single dimension. To plot multiple dimensions in different shapes, facets,
etc., use standard ggplot.
Limited customizability of ts_plot is available via options. See examples.
See also
ts_ggplot(), for a plotting function based on ggplot2.
ts_dygraphs(), for interactive time series plots. ts_save() to
save a plot to the file system.
Examples
# \donttest{
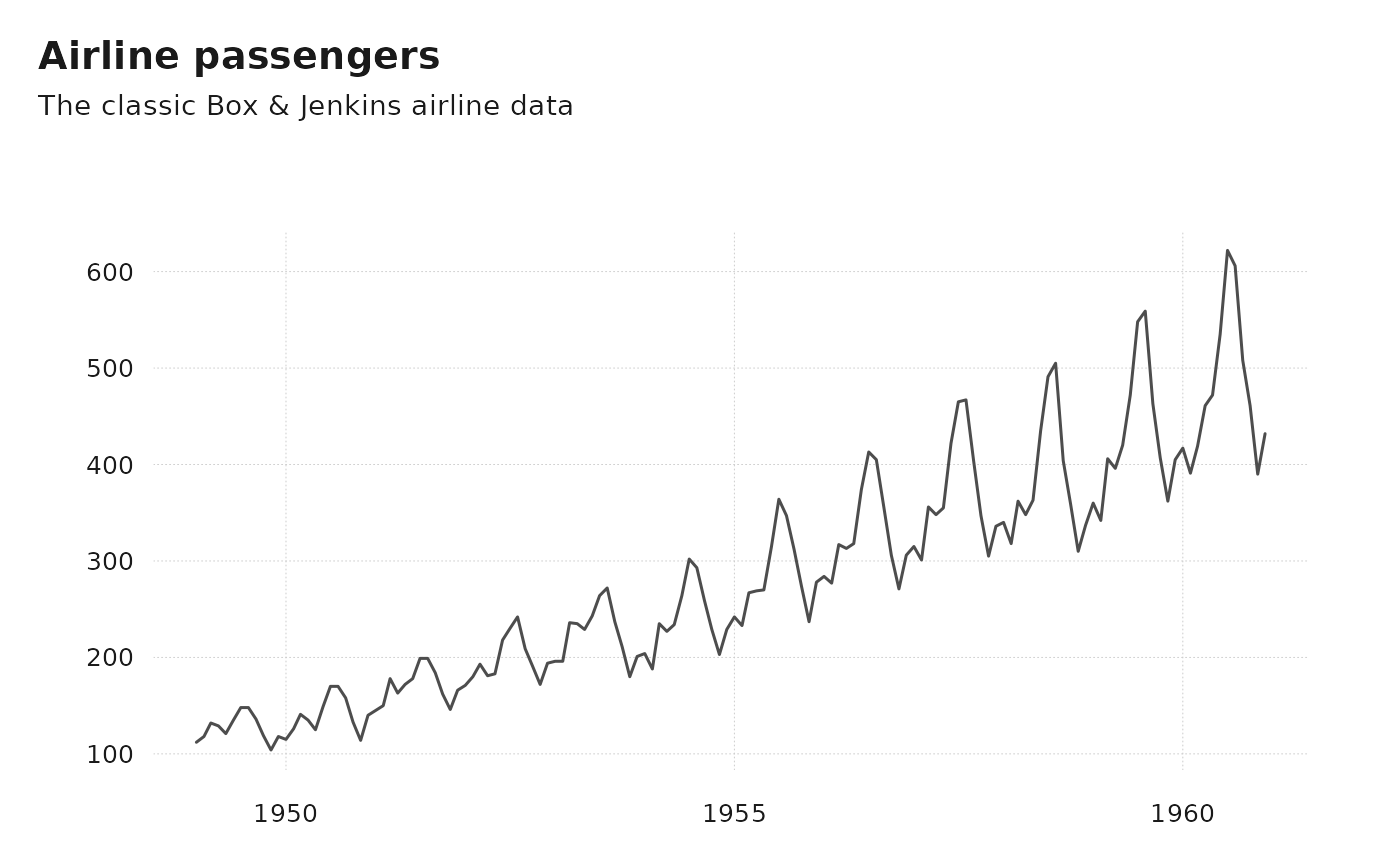
ts_plot(
AirPassengers,
title = "Airline passengers",
subtitle = "The classic Box & Jenkins airline data"
)
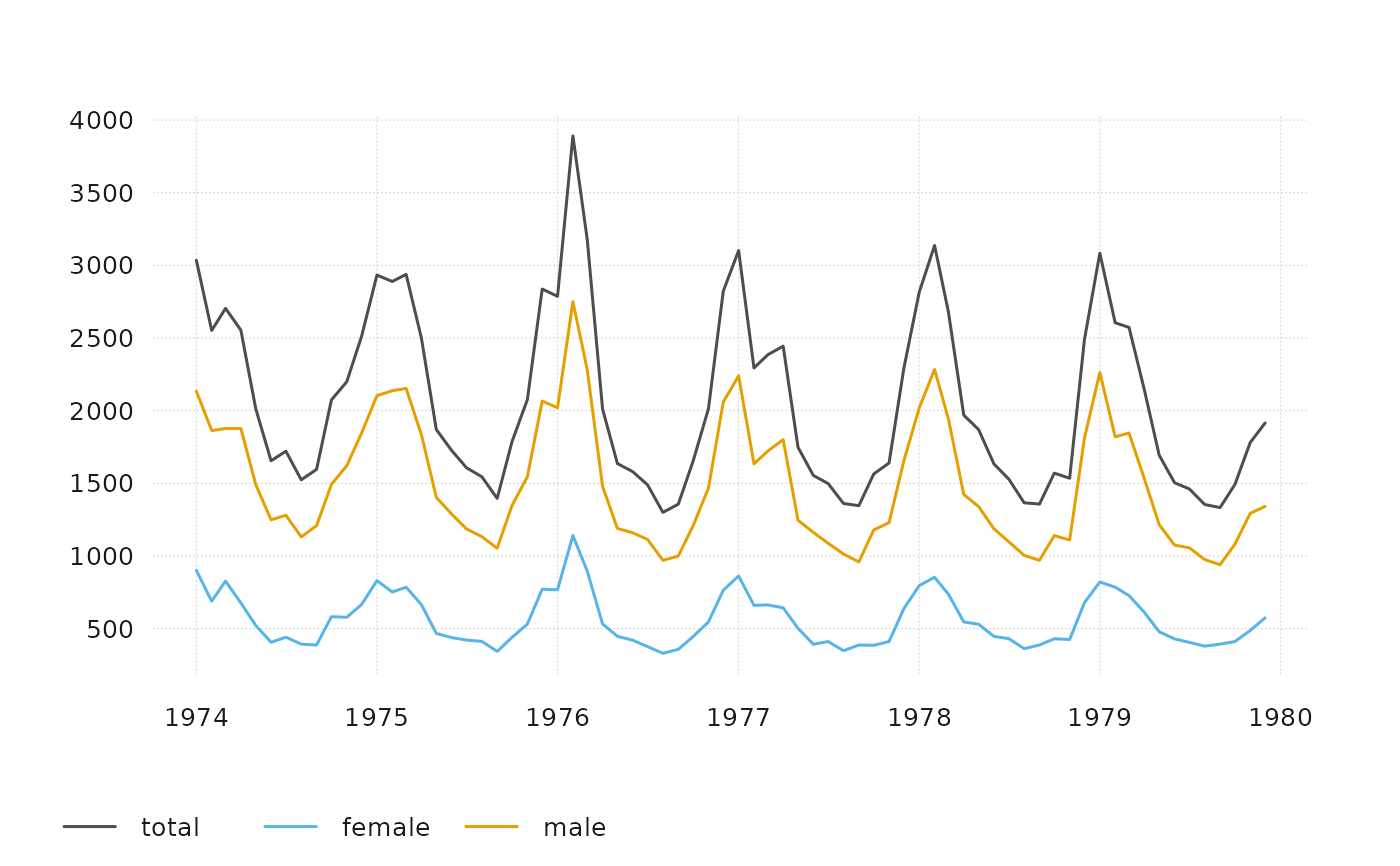
 # naming arguments
ts_plot(total = ldeaths, female = fdeaths, male = mdeaths)
# naming arguments
ts_plot(total = ldeaths, female = fdeaths, male = mdeaths)
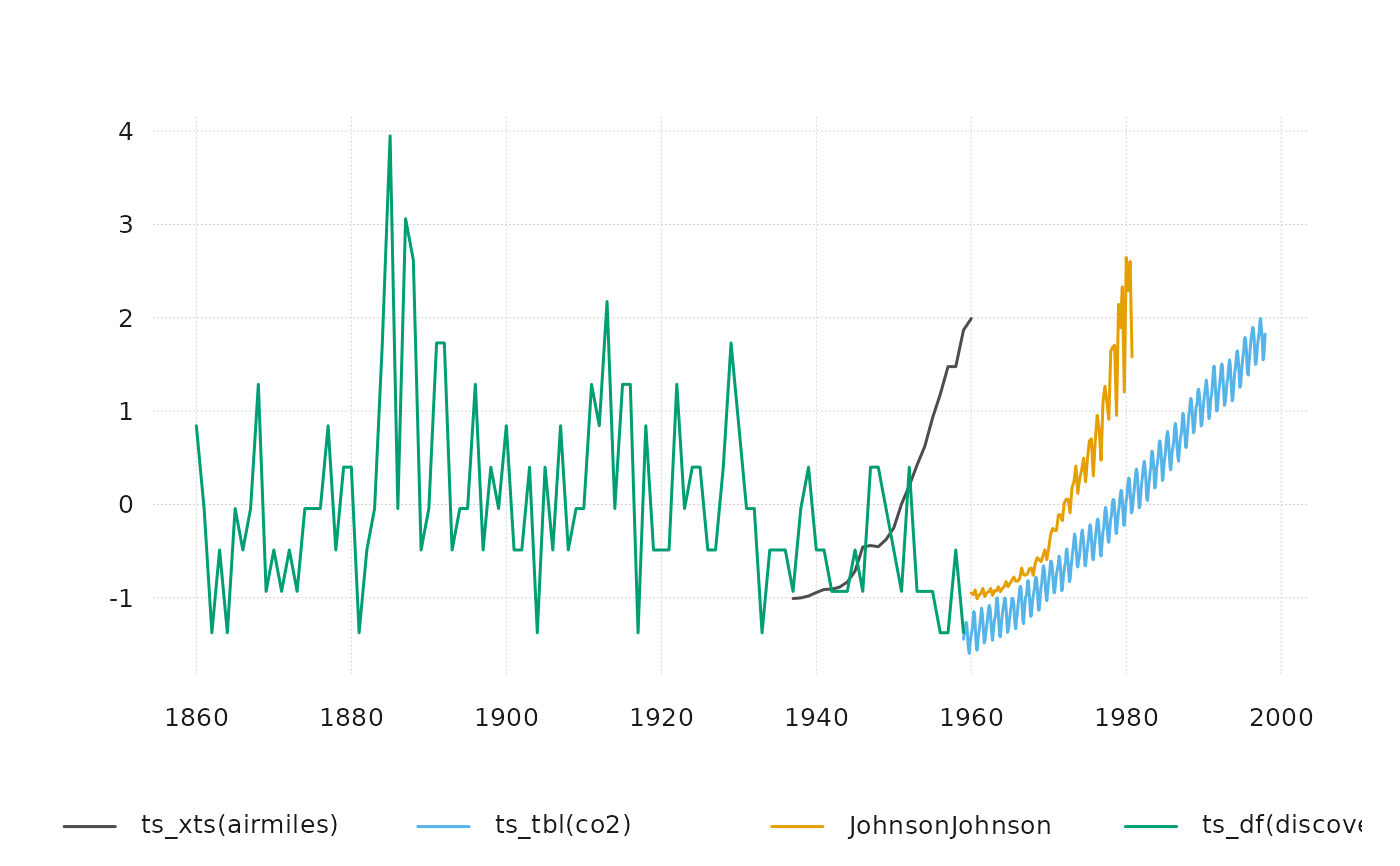
 # using different ts-boxable objects
ts_plot(ts_scale(ts_c(
ts_xts(airmiles),
ts_tbl(co2),
JohnsonJohnson,
ts_df(discoveries)
)))
# using different ts-boxable objects
ts_plot(ts_scale(ts_c(
ts_xts(airmiles),
ts_tbl(co2),
JohnsonJohnson,
ts_df(discoveries)
)))
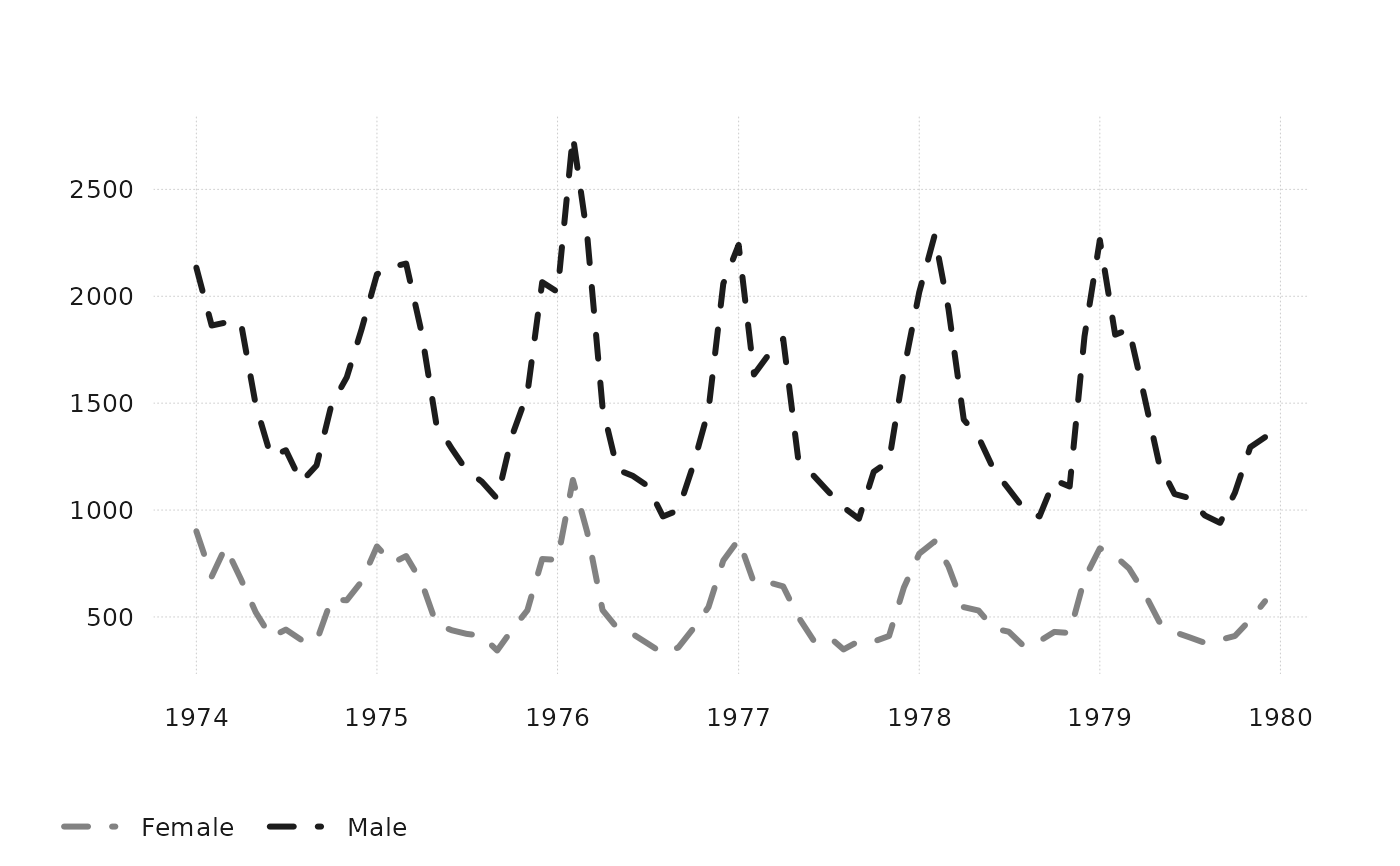
 # customize ts_plot
op <- options(
tsbox.lwd = 3,
tsbox.col = c("gray51", "gray11"),
tsbox.lty = "dashed"
)
ts_plot(
"Female" = fdeaths,
"Male" = mdeaths
)
# customize ts_plot
op <- options(
tsbox.lwd = 3,
tsbox.col = c("gray51", "gray11"),
tsbox.lty = "dashed"
)
ts_plot(
"Female" = fdeaths,
"Male" = mdeaths
)
 options(op) # restore defaults
# }
options(op) # restore defaults
# }