The R ecosystem knows a vast number of time series standards. Instead of creating the ultimate 15th time series class, tsbox provides a set of tools that are agnostic towards the existing standards. The tools also allow you to handle time series as plain data frames, thus making it easy to deal with time series in a dplyr or data.table workflow.
See tsbox.help for the full documentation of the package.
To install the stable version from CRAN:
install.packages("tsbox")To install the development version:
# install.packages("remotes")
remotes::install_github("ropensci/tsbox")
install.packages("ropensci/tsbox", repos = "https://ropensci.r-universe.dev")
Convert everything to everything
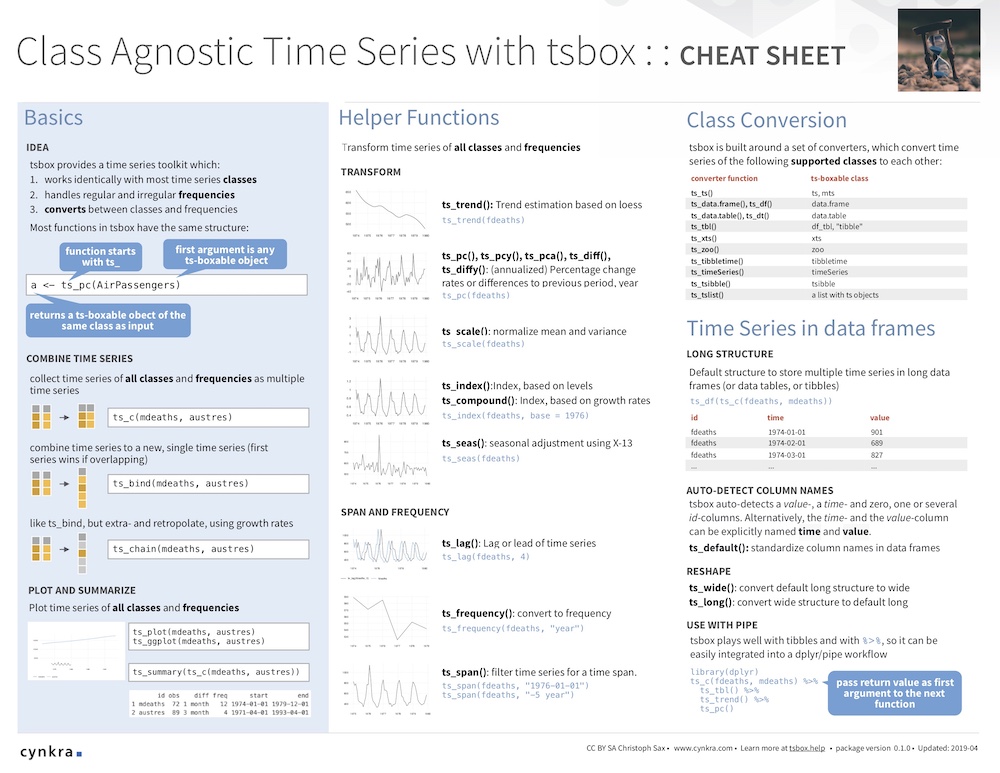
tsbox is built around a set of converters, which convert time series stored as ts, xts, data.frame, data.table, tibble, zoo, zooreg, tsibble, tibbletime, timeSeries, irts or tis to each other:
library(tsbox)
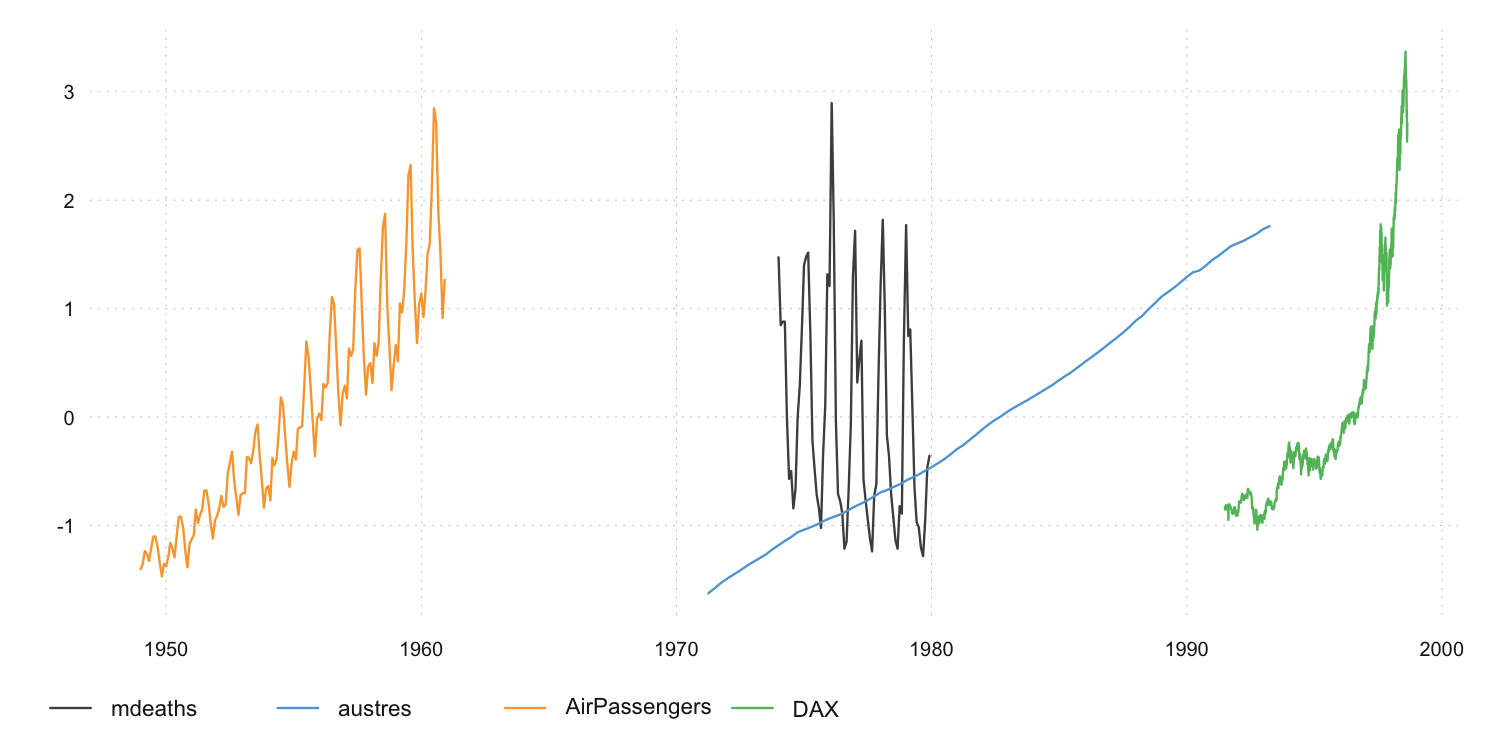
x.ts <- ts_c(fdeaths, mdeaths)
x.xts <- ts_xts(x.ts)
x.df <- ts_df(x.xts)
x.dt <- ts_dt(x.df)
x.tbl <- ts_tbl(x.dt)
x.zoo <- ts_zoo(x.tbl)
x.zooreg <- ts_zoo(x.zoo)
x.tsibble <- ts_tsibble(x.zooreg)
x.tibbletime <- ts_tibbletime(x.tsibble)
x.timeSeries <- ts_timeSeries(x.tibbletime)
x.irts <- ts_irts(x.tibbletime)
x.tis <- ts_tis(x.irts)
all.equal(ts_ts(x.tis), x.ts)
#> [1] TRUEUse same functions for time series classes
Because this works reliably, it is easy to write functions that work for all classes. So whether we want to smooth, scale, differentiate, chain, forecast, regularize or seasonally adjust a time series, we can use the same commands to whatever time series class at hand:
Time series of the world, unite!
A set of helper functions makes it easy to combine or align multiple time series of all classes: