weatherOz
Rodrigo Pires, Anna Hepworth, Rebecca O’Leary, Jonathan Carroll, Dean Marchiori, Paul Melloy, Mark Padgham, Hugh Parsonage, Keith Pembleton and Adam H. Sparks
Source:vignettes/weatherOz.Rmd
weatherOz.RmdIntroduction
{weatherOz} provides automated downloading, parsing, and formatting of weather data for Australia through API endpoints provided by the Department of Primary Industries and Regional Development (DPIRD) of Western Australia, and by the Science and Technology Division of the Queensland Government’s Department of Environment and Science (DES). As well as Australian Government Bureau of Meteorology (‘BOM’) précis and coastal forecasts, and downloading and importing radar and satellite imagery files.
DPIRD weather data are accessed through public APIs provided by DPIRD, https://www.dpird.wa.gov.au/online-tools/apis/, providing access to weather station data from DPIRD’s own weather station network. Detailed information on using {weatherOz} with DPIRD data is available in the weatherOz for the DPIRD Weather 2.0 API vignette.
Australia-wide weather data are based on data from the Australian Bureau of Meteorology (BOM) data and accessed through SILO (Scientific Information for Land Owners) (Jeffery et al., 2001). More details on using {weatherOz} with SILO data are available in the weatherOz for the SILO API vignette.
Weather forecast data are available from the Norwegian Meteorological Institute (MET Weather API) Locationforecast endpoint, providing up to 9 days of forecast data for locations across Australia. Details on using {weatherOz} with MET Weather API forecast data are available in the weatherOz for met.no Forecasts vignette.
The BOM also serves several types of data data as XML, JSON and SHTML
files. This package fetches these files, parses them and return a data
frame. Satellite and radar imagery files are also made available to the
public via anonymous FTP. {weatherOz} provides functionality to query,
fetch and create terra::SpatRaster() or {stars} objects of
GeoTIFF satellite imagery or a {magick} object of radar image.png files.
For detailed information on using {weatherOz} with BOM data, please see
the weatherOz for BOM Data
Resources vignette.
Following is a quick demonstration of some common tasks that you may wish to undertake while using {weatherOz}.
A Note on API Keys
The examples in this README assume that you have stored your API key in your .Renviron file. {weatherOz} will prompt you to set up your API keys automatically if you haven’t. For more information on the preferred method for setting up your API keys, see Chapter 8 in “What They Forgot to Teach You About R” by Bryan et al. for more on storing details in your .Renviron if you are unfamiliar.
To get a DPIRD API key, you can use get_key() and it
will direct you to the form to request a key and provides instructions
for using usethis::edit_r_environ() to add your key to your
.Renviron so that {weatherOz} will automatically find it. If you have
already set up an API key, this will return that value for you.
get_key(source = "DPIRD")You only need to provide an e-mail address for the SILO API. Using
get_key() will provide you with instructions on what format
to use in your .Renviron so that {weatherOz} will auto-recognise it and
if you have already set up an API key, this will return that value for
you.
Note that you do not need to do this separately, any function requiring an API key will prompt you if you don’t have one set.
Using {weatherOz} to Fetch Daily Summary DPIRD Data
Daily summary weather data is frequently used. The following example will demonstrate how you can find and download weather station data for stations in or near Northam, WA for the year of 2022. This example assumes that you have stored your DPIRD API key in your .Renviron file.
library(weatherOz)
#>
#> Attaching package: 'weatherOz'
#> The following object is masked from 'package:graphics':
#>
#>     plot
#> The following object is masked from 'package:base':
#>
#>     plot

Northam <-
  find_nearby_stations(
    longitude = 116.6620,
    latitude = -31.6540,
    which_api = "dpird",
    distance_km = 20
  )

Northam
#>    station_code station_name longitude  latitude  state elev_m
#>          <fctr>       <char>     <num>     <num> <char>  <int>
#> 1:           NO      Northam  116.6942 -31.65161     WA    163
#> 2:           MK       Muresk  116.6913 -31.72772     WA    251
#>                                                                   owner distance_km
#>                                                                  <char>       <num>
#> 1: WA Department of Primary Industries and Regional Development (DPIRD)        3.23
#> 2: WA Department of Primary Industries and Regional Development (DPIRD)        7.93
There are two stations within 20km of the coordinates for Northam, WA that we provided. We’ll choose the closest, Northam, station_code NO to fetch the daily weather data for all air temperature, rainfall and relative humidity values.
dpird_daily <- get_dpird_summaries(
  station_code = "NO",
  start_date = "2022-01-01",
  end_date = "2022-12-31",
  values = c("airTemperature", "rainfall", "relativeHumidity")
)

dpird_daily
#> Key: <station_code>
#>      station_code station_name longitude  latitude  year month   day       date
#>            <fctr>       <char>     <num>     <num> <int> <int> <int>     <Date>
#>   1:           NO      Northam  116.6942 -31.65161  2022     1     1 2022-01-01
#>   2:           NO      Northam  116.6942 -31.65161  2022     1     2 2022-01-02
#>   3:           NO      Northam  116.6942 -31.65161  2022     1     3 2022-01-03
#>   4:           NO      Northam  116.6942 -31.65161  2022     1     4 2022-01-04
#>   5:           NO      Northam  116.6942 -31.65161  2022     1     5 2022-01-05
#>  ---
#> 361:           NO      Northam  116.6942 -31.65161  2022    12    27 2022-12-27
#> 362:           NO      Northam  116.6942 -31.65161  2022    12    28 2022-12-28
#> 363:           NO      Northam  116.6942 -31.65161  2022    12    29 2022-12-29
#> 364:           NO      Northam  116.6942 -31.65161  2022    12    30 2022-12-30
#> 365:           NO      Northam  116.6942 -31.65161  2022    12    31 2022-12-31
#>      air_tavg air_tmax       air_tmax_time air_tmin       air_tmin_time rainfall
#>         <num>    <num>              <POSc>    <num>              <POSc>    <num>
#>   1:     23.8     32.5 2022-01-01 17:02:00     16.7 2022-01-01 05:17:00        0
#>   2:     25.4     36.1 2022-01-02 16:58:00     14.4 2022-01-02 05:19:00        0
#>   3:     28.0     39.9 2022-01-03 14:42:00     16.6 2022-01-03 05:18:00        0
#>   4:     26.1     36.3 2022-01-04 15:15:00     17.3 2022-01-04 04:22:00        0
#>   5:     27.3     39.1 2022-01-05 16:19:00     16.1 2022-01-05 05:14:00        0
#>  ---
#> 361:     23.0     40.2 2022-12-27 14:48:20     13.7 2022-12-27 05:13:20        0
#> 362:     22.2     40.5 2022-12-28 19:58:20     11.9 2022-12-28 05:33:20        0
#> 363:     26.0     40.2 2022-12-30 03:03:20     13.8 2022-12-29 05:01:40        0
#> 364:     26.6     39.2 2022-12-30 13:50:50     14.5 2022-12-30 04:52:30        0
#> 365:     22.7     31.1 2022-12-31 15:45:50     16.2 2022-12-31 05:23:20        0
#>      rh_avg rh_tmax        rh_tmax_time rh_tmin        rh_tmin_time
#>       <num>   <num>              <POSc>   <num>              <POSc>
#>   1:   39.9    71.5 2022-01-01 04:10:00    14.5 2022-01-01 18:03:00
#>   2:   35.2    63.8 2022-01-02 05:39:00    16.4 2022-01-02 16:58:00
#>   3:   38.0    68.5 2022-01-03 05:22:00    14.4 2022-01-03 16:15:00
#>   4:   45.9    74.2 2022-01-04 04:33:00    20.1 2022-01-04 16:35:00
#>   5:   42.1    77.2 2022-01-05 05:22:00    14.4 2022-01-05 17:21:00
#>  ---
#> 361:   41.8    81.1 2022-12-26 16:03:20    14.6 2022-12-27 16:47:30
#> 362:   32.8    65.4 2022-12-28 05:35:00     9.2 2022-12-28 16:11:40
#> 363:   29.2    62.5 2022-12-29 05:08:20     9.5 2022-12-29 17:31:40
#> 364:   34.4    61.2 2022-12-30 05:06:40     7.9 2022-12-30 14:00:00
#> 365:   59.0    98.9 2022-12-31 05:30:00    24.7 2022-12-31 16:01:40
Using {weatherOz} to Fetch Patched Point SILO Data
Daily weather station observations with interpolated missing values are available from SILO. The following example will demonstrate how you can find and download weather station data for stations in or near Toowoomba, Qld for the year of 2022. This example assumes that you have stored your SILO API key (email address) in your .Renviron file.
library(weatherOz)

Tbar <-
  find_nearby_stations(
    longitude = 151.9507,
    latitude = -27.5598,
    which_api = "silo",
    distance_km = 20
  )

Tbar
#>    station_code         station_name longitude latitude  state elev_m  owner
#>          <fctr>               <char>     <num>    <num> <char>  <num> <char>
#> 1:       041529    Toowoomba Airport  151.9134 -27.5425    QLD  640.9    BOM
#> 2:       040096  Helidon Post Office  152.1246 -27.5504    QLD  155.0    BOM
#> 3:       041011 Cambooya Post Office  151.8650 -27.7072    QLD  476.0    BOM
#> 4:       041512      Cooby Creek Dam  151.9244 -27.3825    QLD  497.0    BOM
#>    distance_km
#>          <num>
#> 1:    4.149375
#> 2:   17.172757
#> 3:   18.433372
#> 4:   19.881135
There are 11 stations within 20km of the coordinates for Toowoomba, Qld that we provided in the SILO database. We’ll choose the closest, Toowoomba, station_code 041103 to fetch the daily weather data for all air temperature, rainfall and relative humidity values.
ppd <- get_patched_point(
  station_code = "041103",
  start_date = "2022-01-01",
  end_date = "2022-12-31",
  values = c("max_temp", "min_temp", "rain", "rh_tmax", "rh_tmin")
)

ppd
#>      station_code station_name  year month   day       date air_tmax
#>            <fctr>       <char> <num> <num> <int>     <Date>    <num>
#>   1:       041103    Toowoomba  2022     1     1 2022-01-01     22.8
#>   2:       041103    Toowoomba  2022     1     2 2022-01-02     27.7
#>   3:       041103    Toowoomba  2022     1     3 2022-01-03     29.4
#>   4:       041103    Toowoomba  2022     1     4 2022-01-04     30.0
#>   5:       041103    Toowoomba  2022     1     5 2022-01-05     29.5
#>  ---
#> 361:       041103    Toowoomba  2022    12    27 2022-12-27     26.2
#> 362:       041103    Toowoomba  2022    12    28 2022-12-28     26.7
#> 363:       041103    Toowoomba  2022    12    29 2022-12-29     27.6
#> 364:       041103    Toowoomba  2022    12    30 2022-12-30     27.0
#> 365:       041103    Toowoomba  2022    12    31 2022-12-31     27.7
#>      air_tmax_source air_tmin air_tmin_source  elev_m  extracted latitude longitude
#>                <int>    <num>           <int>  <char>     <Date>    <num>     <num>
#>   1:              25     16.6              25 691.0 m 2026-02-05 -27.5836  151.9317
#>   2:              25     14.2              25 691.0 m 2026-02-05 -27.5836  151.9317
#>   3:              25     13.8              25 691.0 m 2026-02-05 -27.5836  151.9317
#>   4:              25     16.8              25 691.0 m 2026-02-05 -27.5836  151.9317
#>   5:              25     17.5              25 691.0 m 2026-02-05 -27.5836  151.9317
#>  ---
#> 361:              25     15.1              25 691.0 m 2026-02-05 -27.5836  151.9317
#> 362:              25     13.0              25 691.0 m 2026-02-05 -27.5836  151.9317
#> 363:              25     14.1              25 691.0 m 2026-02-05 -27.5836  151.9317
#> 364:              25     17.0              25 691.0 m 2026-02-05 -27.5836  151.9317
#> 365:              25     16.4              25 691.0 m 2026-02-05 -27.5836  151.9317
#>      rainfall rainfall_source rh_tmax rh_tmax_source rh_tmin rh_tmin_source
#>         <num>           <int>   <num>          <int>   <num>          <int>
#>   1:      7.6              25    72.1             26   100.0             26
#>   2:      0.1              25    47.1             26   100.0             26
#>   3:      0.0              25    38.8             26   100.0             26
#>   4:      0.0              25    43.1             26    95.7             26
#>   5:      0.0              25    49.2             26   100.0             26
#>  ---
#> 361:      0.0              25    47.9             26    95.0             26
#> 362:      0.2              25    43.7             26   100.0             26
#> 363:      0.0              25    44.1             26   100.0             26
#> 364:      0.7              25    60.3             26   100.0             26
#> 365:      0.4              25    50.9             26   100.0             26
Using {weatherOz} to Fetch 9-day forecast from METNO
Retrieve a 9-day weather forecast for a specified location from the MET Norway (METNO) Locationforecast API. The function get_metno_forecast() returns structured hourly and daily weather variables such as temperature, precipitation, wind speed, and cloud cover, which can be integrated into analytical workflows or decision-support tools.
library(weatherOz)

perth_forecast <- get_metno_forecast(
  latitude = -31.95,
  longitude = 115.86,
  format = "complete"
)

# Inspect the structure
names(perth_forecast)
#> [1] "data"     "raw"      "metadata"

# View the first few rows of hourly data
head(perth_forecast$data)
#>                   time air_temperature relative_humidity wind_speed
#>                 <POSc>           <num>             <num>      <num>
#> 1: 2026-02-05 19:00:00            27.2              31.0        3.2
#> 2: 2026-02-05 20:00:00            29.6              26.4        2.9
#> 3: 2026-02-05 21:00:00            31.7              22.2        2.8
#> 4: 2026-02-05 22:00:00            33.3              18.9        3.3
#> 5: 2026-02-05 23:00:00            34.3              16.8        4.6
#> 6: 2026-02-06 00:00:00            34.0              17.6        5.5
#>    wind_from_direction cloud_area_fraction air_pressure_at_sea_level
#>                  <num>               <num>                     <num>
#> 1:               107.3                   0                    1019.4
#> 2:               116.3                   0                    1018.4
#> 3:               121.9                   0                    1017.2
#> 4:               133.0                   0                    1016.1
#> 5:               153.8                   0                    1015.2
#> 6:               183.7                   0                    1014.4
#>    precipitation_amount  symbol_code
#>                   <num>       <char>
#> 1:                    0 clearsky_day
#> 2:                    0 clearsky_day
#> 3:                    0 clearsky_day
#> 4:                    0 clearsky_day
#> 5:                    0 clearsky_day
#> 6:                    0 clearsky_day
{weatherOz} offers much more functionality that is detailed in other vignettes that document how to use it to get station metadata for any station in the DPIRD or SILO databases, get extreme weather events for the DPIRD station network, get minute data for DPIRD stations, get APSIM formatted data from SILO, get précis forecasts and various imagery files from BOM, get weather forecasts from METNO in the respective vignettes for DPIRD, SILO, BOM and METNO data available through {weatherOz}.
Appendix 1 - Map of DPIRD Station Locations
# this chunk assumes that you have your DPIRD API key in your .Renviron file

if (requireNamespace("ggplot2", quietly = TRUE) &&
    requireNamespace("ggthemes", quietly = TRUE) &&
    requireNamespace("gridExtra", quietly = TRUE) &&
    requireNamespace("grid", quietly = TRUE) &&
    requireNamespace("maps", quietly = TRUE)) {
  library(ggplot2)
  library(mapproj)
  library(maps)
  library(ggthemes)
  library(grid)
  library(gridExtra)
  library(dplyr)

  dpird_stations <-
    get_stations_metadata(which_api = "DPIRD") |>
                         filter_at(vars(latitude, longitude),
                         all_vars(!is.na(.)))

  Aust_map <- map_data("world", region = "Australia")

  dpird_stations <-
    ggplot(dpird_stations, aes(x = longitude, y = latitude)) +
    geom_polygon(
      data = Aust_map,
      aes(x = long, y = lat, group = group),
      color = grey(0.7),
      fill = NA
    ) +
    geom_point(color = grDevices::rgb(0.58, 0.20, 0.13),
               size = 0.09) +
    coord_map(ylim = c(-44, -10),
              xlim = c(112, 154)) +
    theme_map() +
    labs(title = "DPIRD Station Locations Available in Weather 2.0 API",
         caption = "Data: Western Australia Department of Primary Industries and Regional Development (DPIRD)")

  # Using the gridExtra and grid packages add a neatline to the map
  grid.arrange(dpird_stations, ncol = 1)
  grid.rect(
    width = 0.98,
    height = 0.98,
    gp = grid::gpar(
      lwd = 0.25,
      col = "black",
      fill = NA
    )
  )
}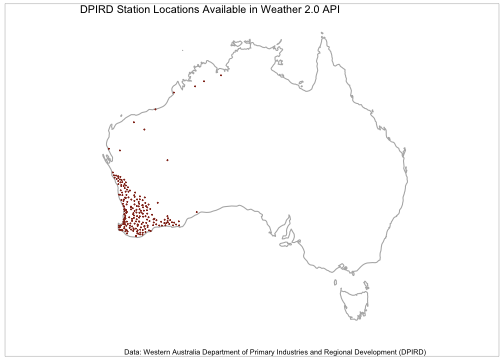
plot of chunk dpird-station-locations-map
Appendix 2 - Map of SILO Station Locations
if (requireNamespace("ggplot2", quietly = TRUE) &&
    requireNamespace("dplyr", quietly = TRUE) &&
    requireNamespace("ggthemes", quietly = TRUE) &&
    requireNamespace("gridExtra", quietly = TRUE) &&
    requireNamespace("grid", quietly = TRUE) &&
    requireNamespace("maps", quietly = TRUE)) {
  library(ggplot2)
  library(mapproj)
  library(maps)
  library(ggthemes)
  library(grid)
  library(gridExtra)

  silo_stations <- get_stations_metadata(which_api = "SILO") |>
                         filter_at(vars(latitude, longitude),
                         all_vars(!is.na(.)))

  Aust_map <- map_data("world", region = "Australia")

  SILO_stations <-
    ggplot(silo_stations, aes(x = longitude, y = latitude)) +
    geom_polygon(
      data = Aust_map,
      aes(x = long, y = lat, group = group),
      color = grey(0.7),
      fill = NA
    ) +
    geom_point(color = grDevices::rgb(0.58, 0.20, 0.13),
               size = 0.09) +
    coord_map(ylim = c(-44, -10),
              xlim = c(112, 154)) +
    theme_map() +
    labs(title = "BOM Station Locations Available in SILO Database",
         caption = "Data: Australia Bureau of Meteorology (BOM)")

  # Using the gridExtra and grid packages add a neatline to the map
  grid.arrange(SILO_stations, ncol = 1)
  grid.rect(
    width = 0.98,
    height = 0.98,
    gp = grid::gpar(
      lwd = 0.25,
      col = "black",
      fill = NA
    )
  )
}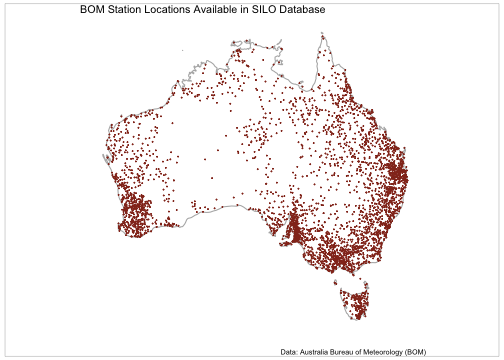
plot of chunk silo-station-locations-map